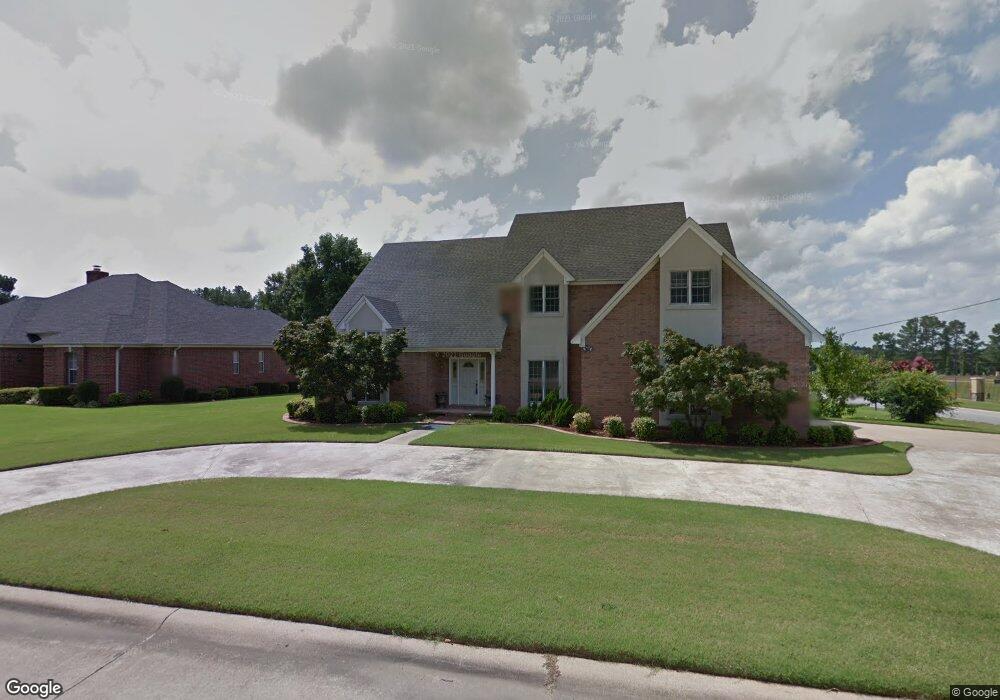
1 Allison Ct Searcy, AR 72143
Estimated Value: $468,105 - $486,000
4
Beds
4
Baths
3,962
Sq Ft
$121/Sq Ft
Est. Value
About This Home
This home is located at 1 Allison Ct, Searcy, AR 72143 and is currently estimated at $480,035, approximately $121 per square foot. 1 Allison Ct is a home located in White County with nearby schools including Westside Elementary School, Southwest Middle School, and Ahlf Junior High School.
Ownership History
Date
Name
Owned For
Owner Type
Purchase Details
Closed on
Apr 23, 2021
Sold by
Kou Cheng Yueh and Chen Yueh Kou Revocable Trust
Bought by
Rainey Roo Llc
Current Estimated Value
Home Financials for this Owner
Home Financials are based on the most recent Mortgage that was taken out on this home.
Original Mortgage
$357,675
Outstanding Balance
$323,196
Interest Rate
3.05%
Mortgage Type
New Conventional
Estimated Equity
$156,839
Purchase Details
Closed on
Apr 22, 2021
Sold by
Rainey Roo Llc
Bought by
Darnell Christopher and Darnell Kellie Jo
Home Financials for this Owner
Home Financials are based on the most recent Mortgage that was taken out on this home.
Original Mortgage
$357,675
Outstanding Balance
$323,196
Interest Rate
3.05%
Mortgage Type
New Conventional
Estimated Equity
$156,839
Purchase Details
Closed on
Jul 2, 1999
Bought by
Kou Yueh C & Cheng Y Rev Trust
Purchase Details
Closed on
Oct 1, 1992
Bought by
Kou Yueh C and Kou Cheng Y
Create a Home Valuation Report for This Property
The Home Valuation Report is an in-depth analysis detailing your home's value as well as a comparison with similar homes in the area
Home Values in the Area
Average Home Value in this Area
Purchase History
| Date | Buyer | Sale Price | Title Company |
|---|---|---|---|
| Rainey Roo Llc | $350,000 | None Available | |
| Rainey Roo Llc | $350,000 | None Listed On Document | |
| Rainey Roo Llc | $350,000 | None Listed On Document | |
| Darnell Christopher | $376,500 | None Available | |
| Darnell Christopher | $376,500 | None Listed On Document | |
| Kou Yueh C & Cheng Y Rev Trust | -- | -- | |
| Kou Yueh C | $17,000 | -- |
Source: Public Records
Mortgage History
| Date | Status | Borrower | Loan Amount |
|---|---|---|---|
| Open | Rainey Roo Llc | $357,675 | |
| Closed | Darnell Christopher | $357,675 |
Source: Public Records
Tax History Compared to Growth
Tax History
| Year | Tax Paid | Tax Assessment Tax Assessment Total Assessment is a certain percentage of the fair market value that is determined by local assessors to be the total taxable value of land and additions on the property. | Land | Improvement |
|---|---|---|---|---|
| 2025 | $2,257 | $55,580 | $6,600 | $48,980 |
| 2024 | $2,257 | $55,580 | $6,600 | $48,980 |
| 2023 | $1,832 | $55,580 | $6,600 | $48,980 |
| 2022 | $1,882 | $55,580 | $6,600 | $48,980 |
| 2021 | $1,882 | $55,580 | $6,600 | $48,980 |
| 2020 | $2,857 | $70,370 | $9,280 | $61,090 |
| 2019 | $2,857 | $70,370 | $9,280 | $61,090 |
| 2018 | $2,857 | $70,370 | $9,280 | $61,090 |
| 2017 | $2,719 | $70,370 | $9,280 | $61,090 |
| 2016 | $2,719 | $66,980 | $9,280 | $57,700 |
| 2015 | $2,472 | $60,890 | $7,260 | $53,630 |
| 2014 | $2,472 | $60,890 | $7,260 | $53,630 |
Source: Public Records
Map
Nearby Homes