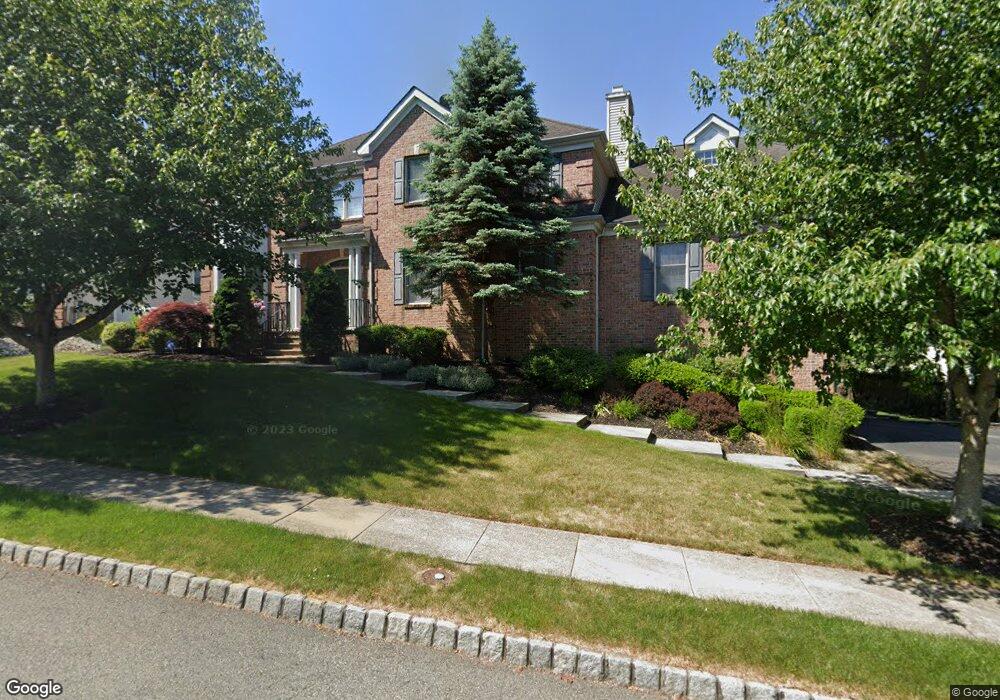
1 Allsop Ct West Orange, NJ 07052
Estimated Value: $1,051,000 - $1,628,000
--
Bed
--
Bath
3,146
Sq Ft
$428/Sq Ft
Est. Value
About This Home
This home is located at 1 Allsop Ct, West Orange, NJ 07052 and is currently estimated at $1,347,138, approximately $428 per square foot. 1 Allsop Ct is a home located in Essex County with nearby schools including West Orange High School and Mount Carmel Guild High School.
Ownership History
Date
Name
Owned For
Owner Type
Purchase Details
Closed on
Jul 15, 2010
Sold by
Goldson Carey and Tuboku Metzger Folarin
Bought by
Amadi Bertram I and Okoli Ugochi
Current Estimated Value
Home Financials for this Owner
Home Financials are based on the most recent Mortgage that was taken out on this home.
Original Mortgage
$708,592
Outstanding Balance
$471,809
Interest Rate
4.76%
Mortgage Type
FHA
Estimated Equity
$875,329
Purchase Details
Closed on
Nov 10, 2003
Sold by
Essex Crest
Bought by
Goldson Carey and Metzger Folarin Tuboku
Home Financials for this Owner
Home Financials are based on the most recent Mortgage that was taken out on this home.
Original Mortgage
$518,000
Interest Rate
5.9%
Create a Home Valuation Report for This Property
The Home Valuation Report is an in-depth analysis detailing your home's value as well as a comparison with similar homes in the area
Home Values in the Area
Average Home Value in this Area
Purchase History
| Date | Buyer | Sale Price | Title Company |
|---|---|---|---|
| Amadi Bertram I | $770,000 | Fidelity Natl Title Ins Co | |
| Goldson Carey | $679,596 | -- |
Source: Public Records
Mortgage History
| Date | Status | Borrower | Loan Amount |
|---|---|---|---|
| Open | Amadi Bertram I | $708,592 | |
| Previous Owner | Goldson Carey | $518,000 |
Source: Public Records
Tax History Compared to Growth
Tax History
| Year | Tax Paid | Tax Assessment Tax Assessment Total Assessment is a certain percentage of the fair market value that is determined by local assessors to be the total taxable value of land and additions on the property. | Land | Improvement |
|---|---|---|---|---|
| 2025 | $33,492 | $945,900 | $402,600 | $543,300 |
| 2024 | $33,492 | $728,400 | $223,800 | $504,600 |
| 2022 | $32,319 | $728,400 | $223,800 | $504,600 |
| 2021 | $31,715 | $728,400 | $223,800 | $504,600 |
| 2020 | $31,205 | $728,400 | $223,800 | $504,600 |
| 2019 | $30,309 | $728,400 | $223,800 | $504,600 |
| 2018 | $29,413 | $728,400 | $223,800 | $504,600 |
| 2017 | $29,034 | $728,400 | $223,800 | $504,600 |
| 2016 | $28,335 | $728,400 | $223,800 | $504,600 |
| 2015 | $27,803 | $728,400 | $223,800 | $504,600 |
| 2014 | $27,257 | $728,400 | $223,800 | $504,600 |
Source: Public Records
Map
Nearby Homes