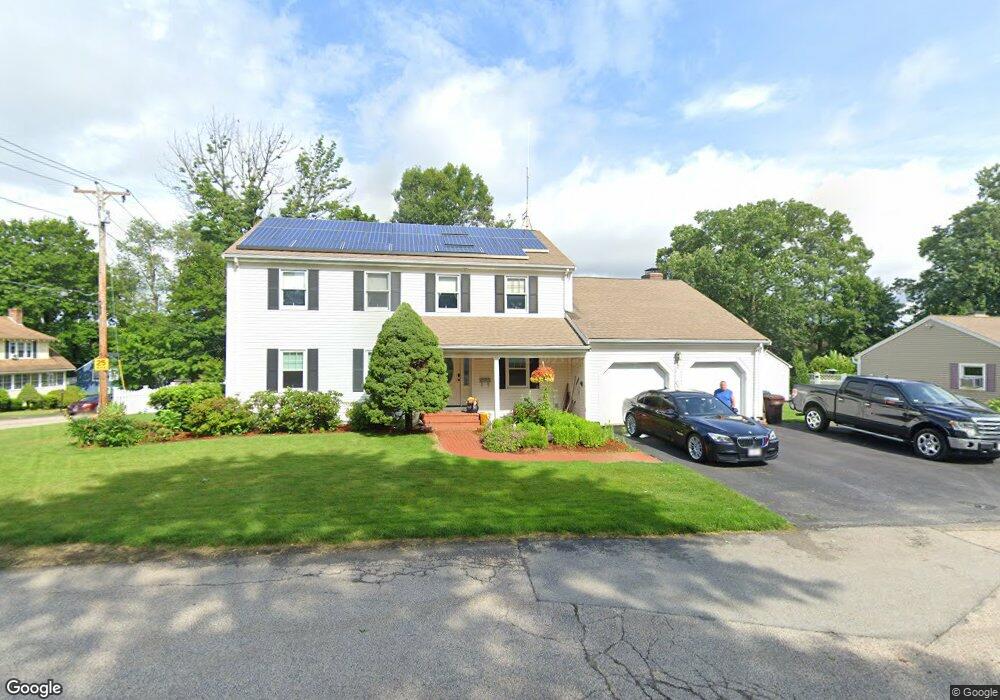
1 Arrowhead Ave Auburn, MA 01501
Downtown Auburn NeighborhoodEstimated Value: $623,000 - $794,000
3
Beds
3
Baths
2,588
Sq Ft
$272/Sq Ft
Est. Value
About This Home
This home is located at 1 Arrowhead Ave, Auburn, MA 01501 and is currently estimated at $704,754, approximately $272 per square foot. 1 Arrowhead Ave is a home located in Worcester County with nearby schools including Auburn Senior High School and Shrewsbury Montessori School - Auburn Campus.
Ownership History
Date
Name
Owned For
Owner Type
Purchase Details
Closed on
Aug 28, 2001
Sold by
Raths Christopher and Warner Alison A
Bought by
Cataldo Rockwood J and Cataldo Donna L
Current Estimated Value
Purchase Details
Closed on
Sep 8, 1997
Sold by
Est Scavone Nicholas D and Scavone Patrice A
Bought by
Scavone Patrice A
Purchase Details
Closed on
Nov 15, 1995
Sold by
Scavone Patrice
Bought by
Raths Christopher and Warner Alison
Create a Home Valuation Report for This Property
The Home Valuation Report is an in-depth analysis detailing your home's value as well as a comparison with similar homes in the area
Home Values in the Area
Average Home Value in this Area
Purchase History
| Date | Buyer | Sale Price | Title Company |
|---|---|---|---|
| Cataldo Rockwood J | $295,000 | -- | |
| Scavone Patrice A | $10,000 | -- | |
| Raths Christopher | $189,900 | -- |
Source: Public Records
Mortgage History
| Date | Status | Borrower | Loan Amount |
|---|---|---|---|
| Open | Raths Christopher | $169,400 | |
| Closed | Raths Christopher | $190,000 |
Source: Public Records
Tax History
| Year | Tax Paid | Tax Assessment Tax Assessment Total Assessment is a certain percentage of the fair market value that is determined by local assessors to be the total taxable value of land and additions on the property. | Land | Improvement |
|---|---|---|---|---|
| 2025 | $91 | $636,900 | $137,700 | $499,200 |
| 2024 | $9,218 | $617,400 | $131,100 | $486,300 |
| 2023 | $8,783 | $553,100 | $119,200 | $433,900 |
| 2022 | $8,035 | $477,700 | $119,200 | $358,500 |
| 2021 | $5,427 | $440,700 | $105,200 | $335,500 |
| 2020 | $5,308 | $440,700 | $105,200 | $335,500 |
| 2019 | $7,482 | $406,200 | $104,100 | $302,100 |
| 2018 | $7,334 | $397,700 | $97,400 | $300,300 |
| 2017 | $0 | $388,600 | $88,300 | $300,300 |
| 2016 | $6,641 | $367,100 | $92,600 | $274,500 |
| 2015 | $6,283 | $364,000 | $92,600 | $271,400 |
| 2014 | $6,164 | $356,500 | $88,100 | $268,400 |
Source: Public Records
Map
Nearby Homes
- 8 South Terrace
- 36 Central St
- 61 School St
- 166 Leicester St
- 6 George St
- 328 Oxford St N
- 33 Eastford Rd
- 51 Old Cart Rd
- 137 South St
- 55 Old Common Rd
- 5 Rice Rd
- 19-20 Williams St
- 634 Oxford St S
- 12 Bylund Ave
- 401 Forest Park Dr
- 9 Santom St
- 2902 Forest Park Dr Unit 2902
- 14 Goddard Dr
- 1-9 Helens Way
- 177 Oxford St N
Your Personal Tour Guide
Ask me questions while you tour the home.