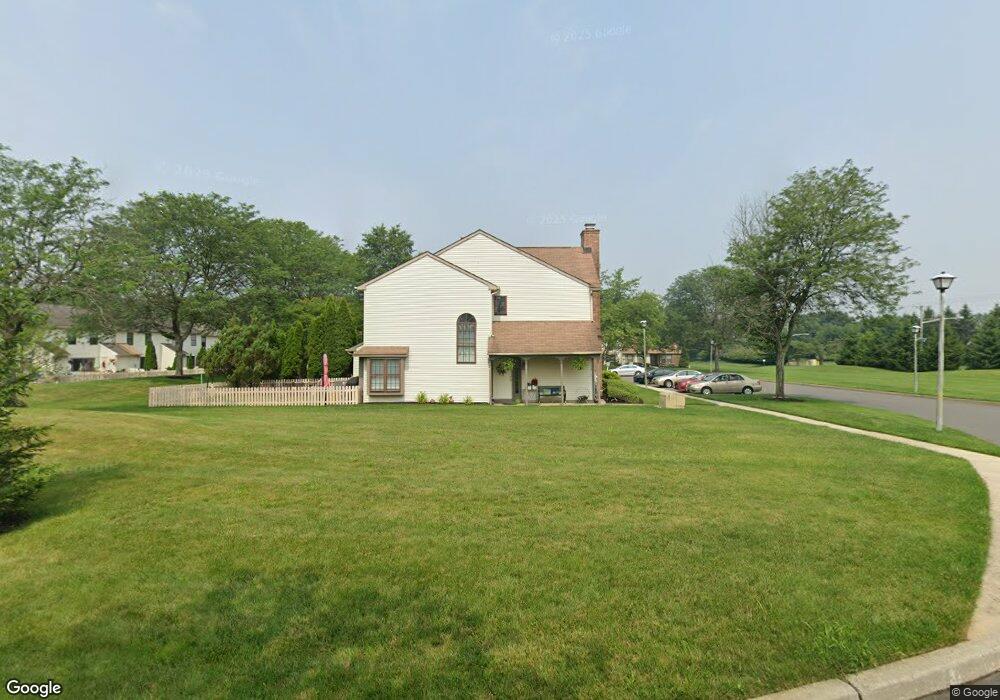
1 Ashford Ct Trenton, NJ 08691
Estimated Value: $457,000 - $511,000
3
Beds
3
Baths
1,369
Sq Ft
$350/Sq Ft
Est. Value
About This Home
This home is located at 1 Ashford Ct, Trenton, NJ 08691 and is currently estimated at $479,584, approximately $350 per square foot. 1 Ashford Ct is a home located in Mercer County with nearby schools including Sharon Elementary School, Pond Road Middle School, and Robbinsville High School.
Ownership History
Date
Name
Owned For
Owner Type
Purchase Details
Closed on
Apr 20, 2006
Current Estimated Value
Purchase Details
Closed on
Apr 1, 2006
Sold by
Gellert Eileen
Bought by
Martell Guillermo
Purchase Details
Closed on
May 31, 1995
Sold by
Neves Norberto
Bought by
Gellert Eileen and Gellert Steven
Home Financials for this Owner
Home Financials are based on the most recent Mortgage that was taken out on this home.
Original Mortgage
$118,000
Interest Rate
8.2%
Mortgage Type
FHA
Create a Home Valuation Report for This Property
The Home Valuation Report is an in-depth analysis detailing your home's value as well as a comparison with similar homes in the area
Home Values in the Area
Average Home Value in this Area
Purchase History
| Date | Buyer | Sale Price | Title Company |
|---|---|---|---|
| -- | $285,800 | -- | |
| Martell Guillermo | $285,812 | -- | |
| Gellert Eileen | $118,000 | -- |
Source: Public Records
Mortgage History
| Date | Status | Borrower | Loan Amount |
|---|---|---|---|
| Previous Owner | Gellert Eileen | $118,000 |
Source: Public Records
Tax History Compared to Growth
Tax History
| Year | Tax Paid | Tax Assessment Tax Assessment Total Assessment is a certain percentage of the fair market value that is determined by local assessors to be the total taxable value of land and additions on the property. | Land | Improvement |
|---|---|---|---|---|
| 2025 | $7,740 | $231,600 | $109,000 | $122,600 |
| 2024 | $7,224 | $231,600 | $109,000 | $122,600 |
| 2023 | $7,224 | $231,600 | $109,000 | $122,600 |
| 2022 | $6,943 | $231,600 | $109,000 | $122,600 |
| 2021 | $6,844 | $231,600 | $109,000 | $122,600 |
| 2020 | $6,846 | $231,600 | $109,000 | $122,600 |
| 2019 | $6,848 | $231,600 | $109,000 | $122,600 |
| 2018 | $6,804 | $231,600 | $109,000 | $122,600 |
| 2017 | $6,791 | $231,600 | $109,000 | $122,600 |
| 2016 | $6,728 | $231,600 | $109,000 | $122,600 |
| 2015 | $6,626 | $231,600 | $109,000 | $122,600 |
| 2014 | $6,649 | $231,600 | $109,000 | $122,600 |
Source: Public Records
Map
Nearby Homes