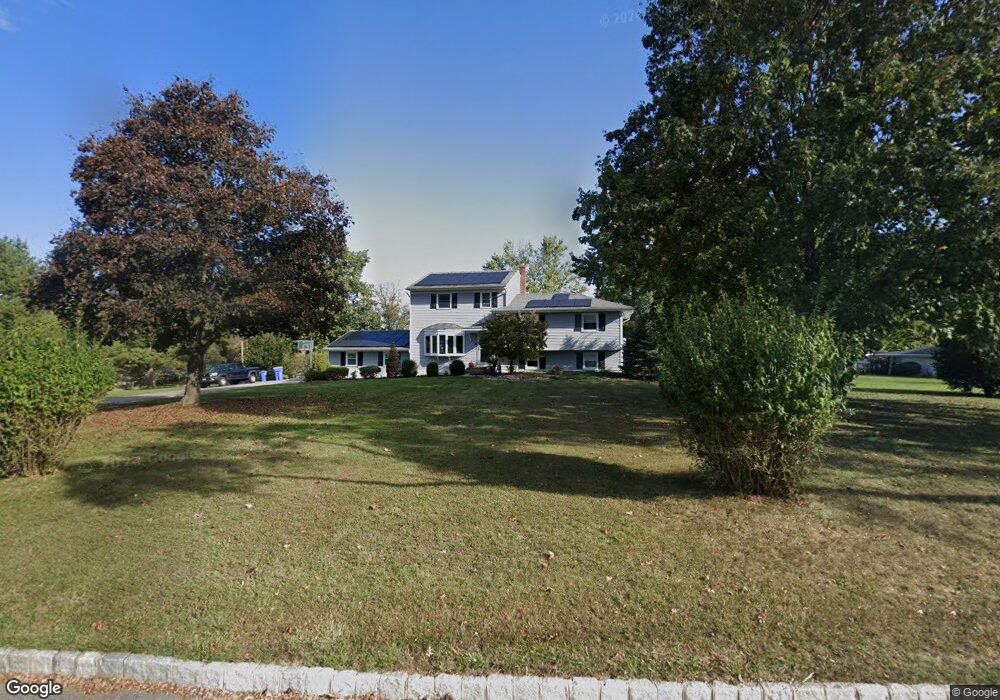
1 Bennie Rd Flemington, NJ 08822
Estimated Value: $617,171 - $684,000
--
Bed
--
Bath
2,344
Sq Ft
$280/Sq Ft
Est. Value
About This Home
This home is located at 1 Bennie Rd, Flemington, NJ 08822 and is currently estimated at $657,043, approximately $280 per square foot. 1 Bennie Rd is a home located in Hunterdon County with nearby schools including Barley Sheaf Elementary School, J.P. Case Middle School, and Reading Fleming Intermediate School.
Ownership History
Date
Name
Owned For
Owner Type
Purchase Details
Closed on
Jun 24, 1999
Sold by
Cioppa Robert A
Bought by
Suk Thomas J and Suk Laurel R
Current Estimated Value
Home Financials for this Owner
Home Financials are based on the most recent Mortgage that was taken out on this home.
Original Mortgage
$183,120
Outstanding Balance
$49,650
Interest Rate
7.39%
Estimated Equity
$607,393
Create a Home Valuation Report for This Property
The Home Valuation Report is an in-depth analysis detailing your home's value as well as a comparison with similar homes in the area
Home Values in the Area
Average Home Value in this Area
Purchase History
| Date | Buyer | Sale Price | Title Company |
|---|---|---|---|
| Suk Thomas J | $228,900 | -- |
Source: Public Records
Mortgage History
| Date | Status | Borrower | Loan Amount |
|---|---|---|---|
| Open | Suk Thomas J | $183,120 |
Source: Public Records
Tax History Compared to Growth
Tax History
| Year | Tax Paid | Tax Assessment Tax Assessment Total Assessment is a certain percentage of the fair market value that is determined by local assessors to be the total taxable value of land and additions on the property. | Land | Improvement |
|---|---|---|---|---|
| 2025 | $11,301 | $390,100 | $190,000 | $200,100 |
| 2024 | $10,626 | $390,100 | $190,000 | $200,100 |
| 2023 | $10,626 | $390,100 | $190,000 | $200,100 |
| 2022 | $10,357 | $390,100 | $190,000 | $200,100 |
| 2021 | $9,827 | $390,100 | $190,000 | $200,100 |
| 2020 | $10,029 | $390,100 | $190,000 | $200,100 |
| 2019 | $9,827 | $390,100 | $190,000 | $200,100 |
| 2018 | $9,706 | $390,100 | $190,000 | $200,100 |
| 2017 | $9,557 | $390,100 | $190,000 | $200,100 |
| 2016 | $9,386 | $390,100 | $190,000 | $200,100 |
| 2015 | $9,148 | $390,100 | $190,000 | $200,100 |
| 2014 | $9,027 | $390,100 | $190,000 | $200,100 |
Source: Public Records
Map
Nearby Homes