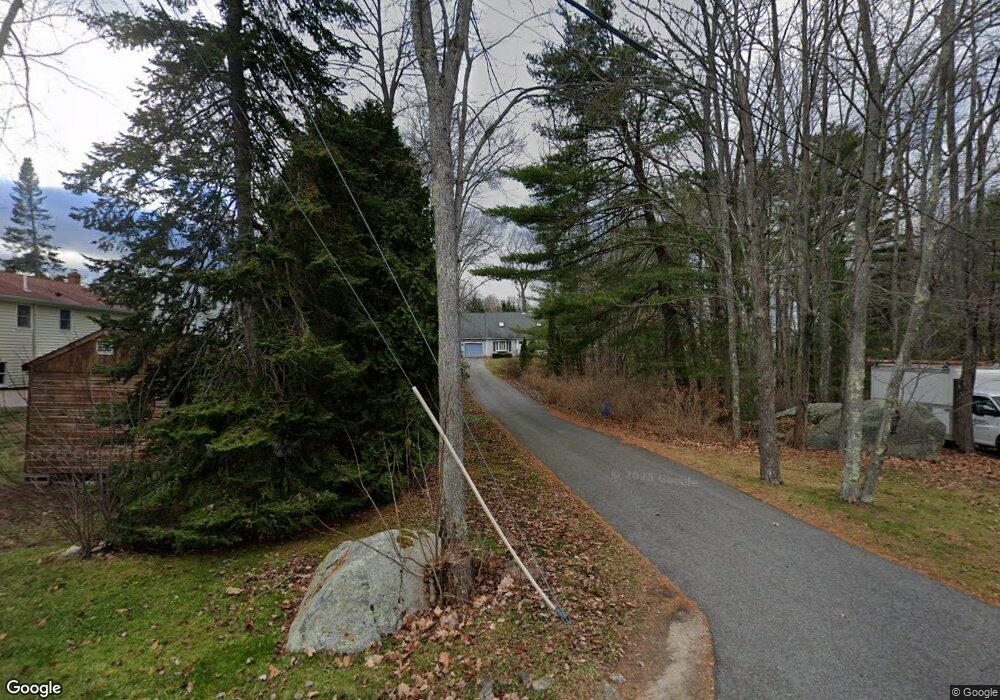
1 Berube Cir Biddeford, ME 04005
Estimated Value: $573,000 - $606,000
4
Beds
3
Baths
2,052
Sq Ft
$288/Sq Ft
Est. Value
About This Home
This home is located at 1 Berube Cir, Biddeford, ME 04005 and is currently estimated at $591,098, approximately $288 per square foot. 1 Berube Cir is a home located in York County with nearby schools including John F Kennedy Memorial School, Biddeford Primary School, and Biddeford Intermediate School.
Ownership History
Date
Name
Owned For
Owner Type
Purchase Details
Closed on
Sep 25, 2021
Sold by
Litalien Victoria E
Bought by
Litalien Anthony M
Current Estimated Value
Purchase Details
Closed on
Apr 1, 2005
Sold by
Corthell Robert L and Corthell Pamela J
Bought by
Litalien Victoria
Home Financials for this Owner
Home Financials are based on the most recent Mortgage that was taken out on this home.
Original Mortgage
$220,000
Interest Rate
5%
Mortgage Type
Adjustable Rate Mortgage/ARM
Create a Home Valuation Report for This Property
The Home Valuation Report is an in-depth analysis detailing your home's value as well as a comparison with similar homes in the area
Home Values in the Area
Average Home Value in this Area
Purchase History
| Date | Buyer | Sale Price | Title Company |
|---|---|---|---|
| Litalien Anthony M | -- | None Available | |
| Litalien Anthony M | -- | None Available | |
| Litalien Anthony M | -- | None Available | |
| Litalien Victoria | -- | -- |
Source: Public Records
Mortgage History
| Date | Status | Borrower | Loan Amount |
|---|---|---|---|
| Previous Owner | Litalien Victoria | $220,000 | |
| Previous Owner | Litalien Victoria | $55,000 |
Source: Public Records
Tax History
| Year | Tax Paid | Tax Assessment Tax Assessment Total Assessment is a certain percentage of the fair market value that is determined by local assessors to be the total taxable value of land and additions on the property. | Land | Improvement |
|---|---|---|---|---|
| 2025 | $6,596 | $441,500 | $185,400 | $256,100 |
| 2024 | $6,255 | $439,900 | $185,400 | $254,500 |
| 2023 | $5,731 | $436,800 | $182,300 | $254,500 |
| 2022 | $5,650 | $344,300 | $105,800 | $238,500 |
| 2021 | $5,305 | $291,000 | $91,300 | $199,700 |
| 2020 | $5,269 | $262,800 | $80,300 | $182,500 |
| 2019 | $5,251 | $262,800 | $80,300 | $182,500 |
| 2018 | $5,177 | $262,800 | $80,300 | $182,500 |
| 2017 | $5,144 | $256,300 | $80,300 | $176,000 |
| 2016 | $5,090 | $256,300 | $80,300 | $176,000 |
| 2015 | $4,990 | $256,300 | $80,300 | $176,000 |
| 2014 | $4,867 | $256,300 | $80,300 | $176,000 |
| 2013 | -- | $260,300 | $83,800 | $176,500 |
Source: Public Records
Map
Nearby Homes
Your Personal Tour Guide
Ask me questions while you tour the home.