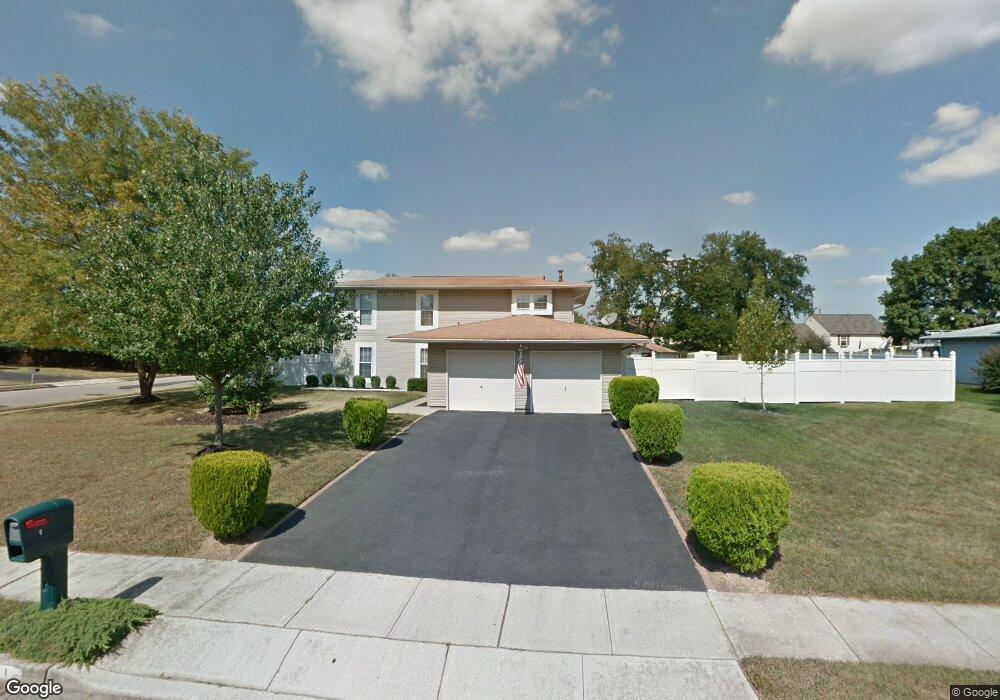
1 Berwick Ct Mount Holly, NJ 08060
Estimated Value: $418,155 - $573,000
Studio
--
Bath
2,408
Sq Ft
$214/Sq Ft
Est. Value
About This Home
This home is located at 1 Berwick Ct, Mount Holly, NJ 08060 and is currently estimated at $514,539, approximately $213 per square foot. 1 Berwick Ct is a home located in Burlington County with nearby schools including Eastampton Township Community School, Rancocas Valley Regional High School, and Sacred Heart School.
Ownership History
Date
Name
Owned For
Owner Type
Purchase Details
Closed on
Jun 17, 1994
Sold by
Lau Yiu Hong and Lau Suk Yuk
Bought by
Kiczek Stanley M and Kiczek Renee E
Current Estimated Value
Create a Home Valuation Report for This Property
The Home Valuation Report is an in-depth analysis detailing your home's value as well as a comparison with similar homes in the area
Home Values in the Area
Average Home Value in this Area
Purchase History
| Date | Buyer | Sale Price | Title Company |
|---|---|---|---|
| Kiczek Stanley M | $119,000 | -- | |
| Kiczek Stanley M | $119,000 | -- |
Source: Public Records
Tax History
| Year | Tax Paid | Tax Assessment Tax Assessment Total Assessment is a certain percentage of the fair market value that is determined by local assessors to be the total taxable value of land and additions on the property. | Land | Improvement |
|---|---|---|---|---|
| 2025 | $8,083 | $253,000 | $53,000 | $200,000 |
| 2024 | $8,331 | $253,000 | $53,000 | $200,000 |
| 2023 | $8,331 | $253,000 | $53,000 | $200,000 |
| 2022 | $8,053 | $253,000 | $53,000 | $200,000 |
| 2021 | $8,056 | $253,000 | $53,000 | $200,000 |
| 2020 | $8,078 | $253,000 | $53,000 | $200,000 |
| 2019 | $7,881 | $253,000 | $53,000 | $200,000 |
| 2018 | $7,899 | $253,000 | $53,000 | $200,000 |
| 2017 | $7,823 | $253,000 | $53,000 | $200,000 |
| 2016 | $7,684 | $250,700 | $53,000 | $197,700 |
| 2015 | $7,699 | $250,700 | $53,000 | $197,700 |
| 2014 | $7,511 | $250,700 | $53,000 | $197,700 |
Source: Public Records
Map
Nearby Homes
Your Personal Tour Guide
Ask me questions while you tour the home.