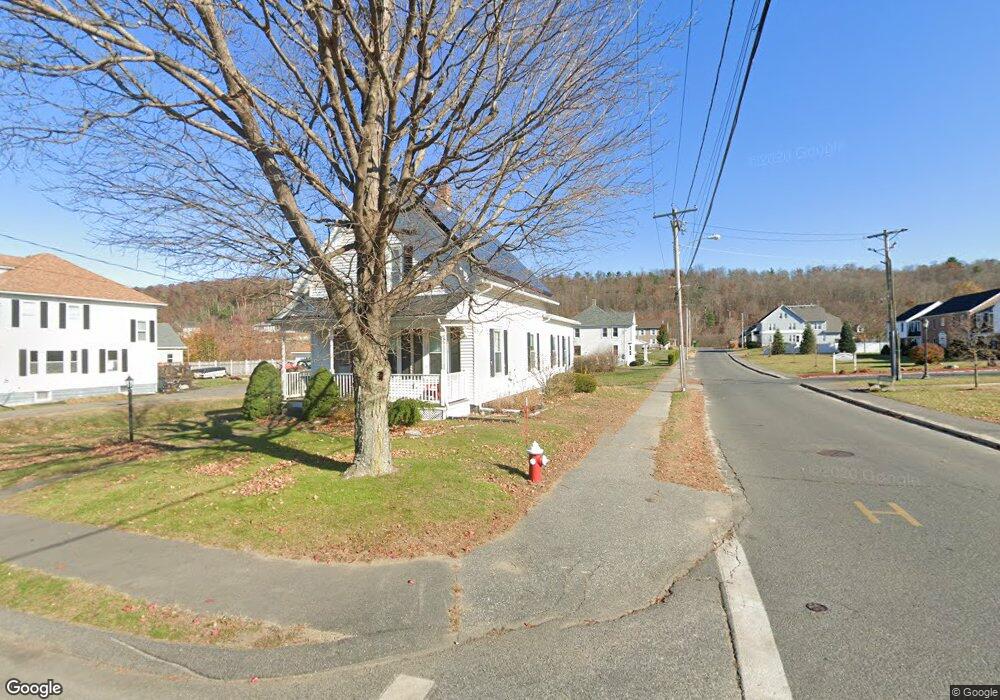
1 Bethany Rd Monson, MA 01057
Estimated Value: $301,453 - $470,000
4
Beds
1
Bath
1,592
Sq Ft
$227/Sq Ft
Est. Value
About This Home
This home is located at 1 Bethany Rd, Monson, MA 01057 and is currently estimated at $360,863, approximately $226 per square foot. 1 Bethany Rd is a home located in Hampden County with nearby schools including Quarry Hill Community School, Granite Valley School, and Monson High School.
Ownership History
Date
Name
Owned For
Owner Type
Purchase Details
Closed on
May 22, 2009
Sold by
Campbell Kathryn J
Bought by
Thorp A John and Thorp Clare L
Current Estimated Value
Home Financials for this Owner
Home Financials are based on the most recent Mortgage that was taken out on this home.
Original Mortgage
$190,740
Outstanding Balance
$121,032
Interest Rate
4.93%
Mortgage Type
Purchase Money Mortgage
Estimated Equity
$239,831
Purchase Details
Closed on
Oct 9, 2002
Sold by
Est Kennedy Elaine and Kennedy William
Bought by
Campbell Kathryn J
Create a Home Valuation Report for This Property
The Home Valuation Report is an in-depth analysis detailing your home's value as well as a comparison with similar homes in the area
Home Values in the Area
Average Home Value in this Area
Purchase History
| Date | Buyer | Sale Price | Title Company |
|---|---|---|---|
| Thorp A John | $187,000 | -- | |
| Campbell Kathryn J | $100,000 | -- |
Source: Public Records
Mortgage History
| Date | Status | Borrower | Loan Amount |
|---|---|---|---|
| Open | Thorp A John | $190,740 | |
| Previous Owner | Campbell Kathryn J | $100,000 |
Source: Public Records
Tax History Compared to Growth
Tax History
| Year | Tax Paid | Tax Assessment Tax Assessment Total Assessment is a certain percentage of the fair market value that is determined by local assessors to be the total taxable value of land and additions on the property. | Land | Improvement |
|---|---|---|---|---|
| 2025 | $3,533 | $237,600 | $54,000 | $183,600 |
| 2024 | $3,523 | $227,300 | $54,000 | $173,300 |
| 2023 | $3,213 | $202,600 | $54,000 | $148,600 |
| 2022 | $3,101 | $173,900 | $54,000 | $119,900 |
| 2021 | $2,892 | $159,600 | $54,000 | $105,600 |
| 2020 | $2,916 | $159,600 | $54,000 | $105,600 |
| 2019 | $2,808 | $153,100 | $54,000 | $99,100 |
| 2018 | $3,177 | $180,500 | $60,000 | $120,500 |
| 2017 | $3,007 | $172,700 | $57,600 | $115,100 |
| 2016 | $2,950 | $172,300 | $57,200 | $115,100 |
| 2015 | $2,872 | $172,300 | $57,200 | $115,100 |
| 2014 | $2,791 | $172,300 | $57,200 | $115,100 |
Source: Public Records
Map
Nearby Homes