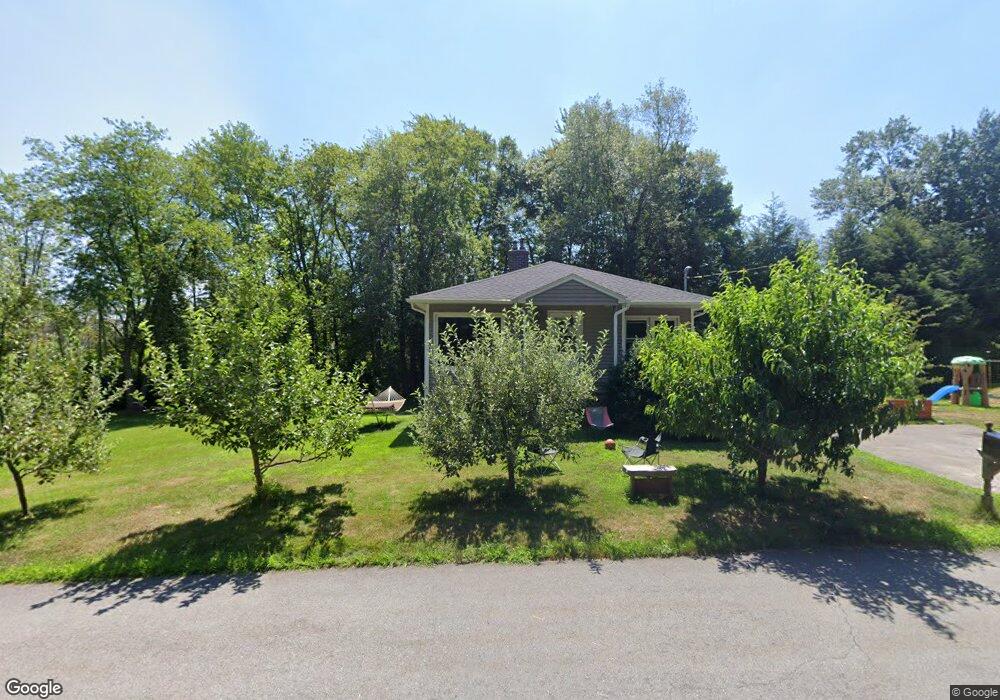
1 Bickford Ln Westborough, MA 01581
Estimated Value: $505,000 - $554,272
3
Beds
1
Bath
1,382
Sq Ft
$384/Sq Ft
Est. Value
About This Home
This home is located at 1 Bickford Ln, Westborough, MA 01581 and is currently estimated at $530,818, approximately $384 per square foot. 1 Bickford Ln is a home located in Worcester County with nearby schools including Westborough High School, Westboro Knowledge Beginnings, and Ebridge Montessori School.
Ownership History
Date
Name
Owned For
Owner Type
Purchase Details
Closed on
Apr 30, 2008
Sold by
Hawes Elizabeth L and Hawes-Smith Janice
Bought by
Leary David R C and Leary Sandra C
Current Estimated Value
Home Financials for this Owner
Home Financials are based on the most recent Mortgage that was taken out on this home.
Original Mortgage
$223,150
Outstanding Balance
$142,131
Interest Rate
5.99%
Mortgage Type
Purchase Money Mortgage
Estimated Equity
$388,687
Create a Home Valuation Report for This Property
The Home Valuation Report is an in-depth analysis detailing your home's value as well as a comparison with similar homes in the area
Home Values in the Area
Average Home Value in this Area
Purchase History
| Date | Buyer | Sale Price | Title Company |
|---|---|---|---|
| Leary David R C | $234,900 | -- |
Source: Public Records
Mortgage History
| Date | Status | Borrower | Loan Amount |
|---|---|---|---|
| Open | Leary David R C | $223,150 |
Source: Public Records
Tax History Compared to Growth
Tax History
| Year | Tax Paid | Tax Assessment Tax Assessment Total Assessment is a certain percentage of the fair market value that is determined by local assessors to be the total taxable value of land and additions on the property. | Land | Improvement |
|---|---|---|---|---|
| 2025 | $7,322 | $449,500 | $316,700 | $132,800 |
| 2024 | $6,717 | $409,300 | $281,600 | $127,700 |
| 2023 | $6,342 | $376,600 | $265,500 | $111,100 |
| 2022 | $6,159 | $333,100 | $224,500 | $108,600 |
| 2021 | $6,051 | $326,400 | $214,800 | $111,600 |
| 2020 | $5,725 | $312,500 | $197,200 | $115,300 |
| 2019 | $5,440 | $296,800 | $199,200 | $97,600 |
| 2018 | $4,977 | $269,600 | $191,300 | $78,300 |
| 2017 | $4,799 | $269,600 | $191,300 | $78,300 |
| 2016 | $4,537 | $255,300 | $175,700 | $79,600 |
| 2015 | $4,415 | $237,500 | $156,200 | $81,300 |
Source: Public Records
Map
Nearby Homes
- 5 Chauncy Cir
- 3 Dover Way
- 196 -198 Turnpike Rd
- 14 Mayberry Dr Unit 10
- 7 Mayberry Dr Unit H
- 23 Water St
- 9 Treetop Park
- 19 Treetop Park Unit 19
- 22 Treetop Park
- 8 Stagecoach Cir Unit 8
- 48 High Street Extension
- 9 Shaker Way
- 52 Treetop Park Unit 52
- 12302 Peters Farm Way Unit 302
- 2 Talbot Way Unit 2103
- 2 Talbot Way Unit 2208
- 11101 Peters Farm Way Unit 101
- 3112 Peters Farm Way Unit 112
- 11302 Peters Farm Way Unit 11302
- 3102 Peters Farm Way Unit 102