1 Blackstone St Uxbridge, MA 01569
Estimated Value: $406,379 - $494,000
3
Beds
1
Bath
1,175
Sq Ft
$382/Sq Ft
Est. Value
About This Home
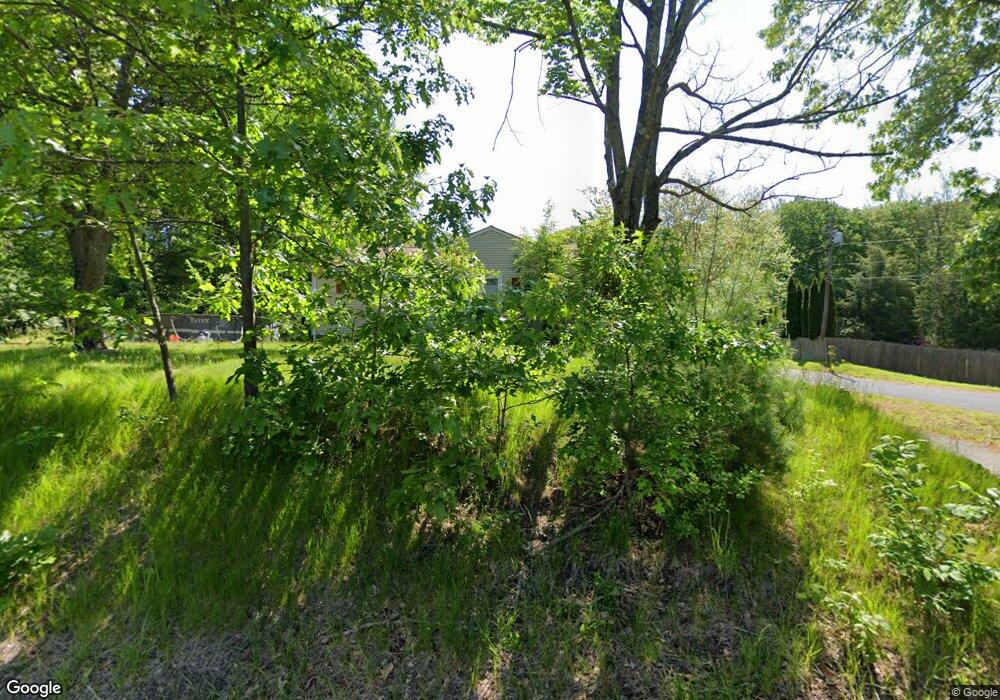
This home is located at 1 Blackstone St, Uxbridge, MA 01569 and is currently estimated at $448,595, approximately $381 per square foot. 1 Blackstone St is a home located in Worcester County with nearby schools including Uxbridge High School and Our Lady of the Valley Regional School.
Ownership History
Date
Name
Owned For
Owner Type
Purchase Details
Closed on
Dec 13, 2021
Sold by
Welby Patrick J and Welby Amy L
Bought by
Welby Amy L
Current Estimated Value
Home Financials for this Owner
Home Financials are based on the most recent Mortgage that was taken out on this home.
Original Mortgage
$264,200
Interest Rate
3.55%
Mortgage Type
New Conventional
Purchase Details
Closed on
Nov 19, 2008
Sold by
Tattersall Dianne M
Bought by
Welby Amy L and Welby Patrick J
Home Financials for this Owner
Home Financials are based on the most recent Mortgage that was taken out on this home.
Original Mortgage
$228,759
Interest Rate
6.03%
Mortgage Type
Purchase Money Mortgage
Create a Home Valuation Report for This Property
The Home Valuation Report is an in-depth analysis detailing your home's value as well as a comparison with similar homes in the area
Home Values in the Area
Average Home Value in this Area
Purchase History
| Date | Buyer | Sale Price | Title Company |
|---|---|---|---|
| Welby Amy L | -- | None Available | |
| Welby Amy L | -- | None Available | |
| Welby Amy L | -- | None Available | |
| Welby Amy L | $230,000 | -- | |
| Welby Amy L | $230,000 | -- | |
| Welby Amy L | $230,000 | -- |
Source: Public Records
Mortgage History
| Date | Status | Borrower | Loan Amount |
|---|---|---|---|
| Previous Owner | Welby Amy L | $264,200 | |
| Previous Owner | Welby Amy L | $229,544 | |
| Previous Owner | Welby Amy L | $232,190 | |
| Previous Owner | Welby Amy L | $228,759 |
Source: Public Records
Tax History
| Year | Tax Paid | Tax Assessment Tax Assessment Total Assessment is a certain percentage of the fair market value that is determined by local assessors to be the total taxable value of land and additions on the property. | Land | Improvement |
|---|---|---|---|---|
| 2025 | $4,491 | $342,600 | $134,900 | $207,700 |
| 2024 | $4,089 | $316,500 | $123,600 | $192,900 |
| 2023 | $3,821 | $273,900 | $112,400 | $161,500 |
| 2022 | $3,731 | $246,100 | $101,900 | $144,200 |
| 2021 | $3,822 | $241,600 | $97,400 | $144,200 |
| 2020 | $3,845 | $229,700 | $101,100 | $128,600 |
| 2019 | $3,817 | $220,000 | $93,700 | $126,300 |
| 2018 | $3,606 | $210,000 | $93,700 | $116,300 |
| 2017 | $3,397 | $200,300 | $88,800 | $111,500 |
| 2016 | $3,674 | $209,100 | $86,300 | $122,800 |
| 2015 | $3,598 | $206,800 | $86,300 | $120,500 |
Source: Public Records
Map
Nearby Homes
- 76 Pouts Ln
- 44 Pouts Ln
- 35 Pouts Ln
- 223 Mendon St
- 24 Olde Canal Way Unit 24
- 25 Dunny Cove Ln
- 13A Asylum St
- 56 S Main St
- 53 Asylum St
- 218 E Hartford Ave Unit 218
- 16 Farnum St
- 79 High St
- 5 Peter St Unit D
- 3 Strathmore Shire Unit A
- 26 Rivulet St
- 12 Hartford Ave E
- 71 Rivulet St Unit B
- 86 Hunter Rd
- 288-290 Providence Rd
- 138 Elm St
Your Personal Tour Guide
Ask me questions while you tour the home.