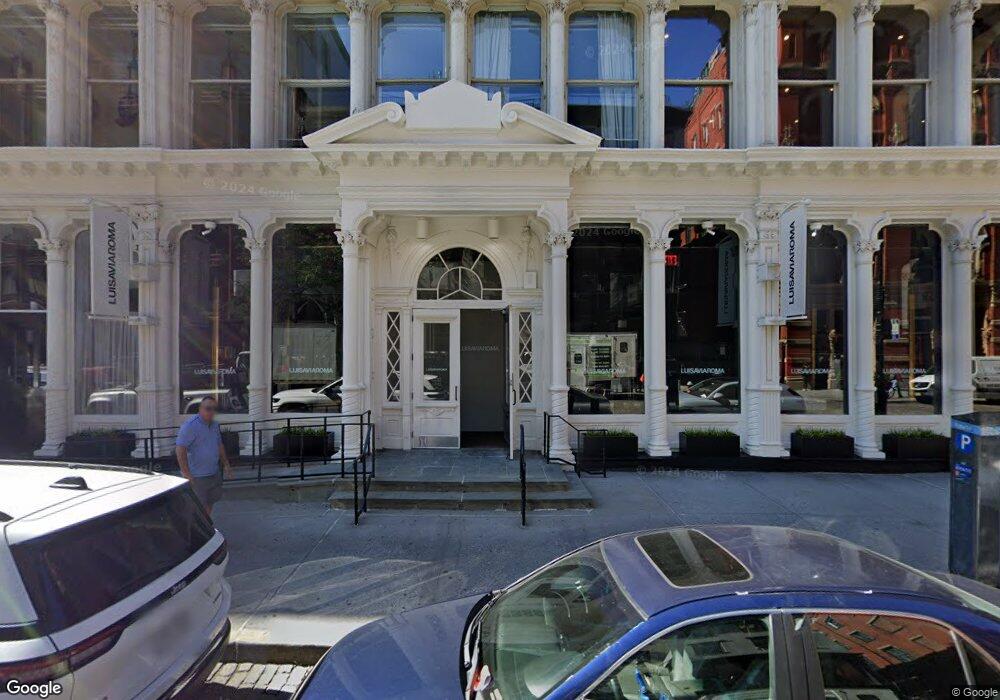
1 Bond St Unit 3A5 New York, NY 10012
Estimated Value: $6,512,000 - $8,534,000
--
Bed
--
Bath
3,742
Sq Ft
$2,022/Sq Ft
Est. Value
About This Home
This home is located at 1 Bond St Unit 3A5, New York, NY 10012 and is currently estimated at $7,565,480, approximately $2,021 per square foot. 1 Bond St Unit 3A5 is a home located in New York County with nearby schools including P.S. 3 Charrette School, Middle School 297, and Clinton School.
Ownership History
Date
Name
Owned For
Owner Type
Purchase Details
Closed on
Sep 23, 2022
Sold by
Berkley Michael
Bought by
Nieuwe Bouwerie Llc
Current Estimated Value
Home Financials for this Owner
Home Financials are based on the most recent Mortgage that was taken out on this home.
Original Mortgage
$2,000,000
Outstanding Balance
$1,910,305
Interest Rate
5.22%
Mortgage Type
Purchase Money Mortgage
Estimated Equity
$5,655,175
Purchase Details
Closed on
Jun 14, 2013
Sold by
Rutherford Mike J
Bought by
Berkley Michael
Home Financials for this Owner
Home Financials are based on the most recent Mortgage that was taken out on this home.
Original Mortgage
$5,000,000
Interest Rate
4.53%
Mortgage Type
Purchase Money Mortgage
Purchase Details
Closed on
Jun 6, 2008
Sold by
Fox Pickard Lisa and Fox Lisa
Bought by
Rutherford Mike J
Purchase Details
Closed on
Jul 27, 2000
Sold by
Goldberg Zvi
Bought by
Pickard Joshua and Pickard Lisa Fox
Create a Home Valuation Report for This Property
The Home Valuation Report is an in-depth analysis detailing your home's value as well as a comparison with similar homes in the area
Home Values in the Area
Average Home Value in this Area
Purchase History
| Date | Buyer | Sale Price | Title Company |
|---|---|---|---|
| Nieuwe Bouwerie Llc | $8,150,000 | -- | |
| Berkley Michael | $7,200,000 | -- | |
| Rutherford Mike J | $5,030,000 | -- | |
| Pickard Joshua | $346,000 | -- |
Source: Public Records
Mortgage History
| Date | Status | Borrower | Loan Amount |
|---|---|---|---|
| Open | Nieuwe Bouwerie Llc | $2,000,000 | |
| Previous Owner | Berkley Michael | $5,000,000 |
Source: Public Records
Tax History Compared to Growth
Tax History
| Year | Tax Paid | Tax Assessment Tax Assessment Total Assessment is a certain percentage of the fair market value that is determined by local assessors to be the total taxable value of land and additions on the property. | Land | Improvement |
|---|---|---|---|---|
| 2025 | $55,271 | $474,398 | $108,309 | $366,089 |
| 2024 | $55,271 | $442,100 | $108,309 | $333,791 |
| 2023 | $51,898 | $423,073 | $108,309 | $314,764 |
| 2022 | $40,106 | $452,583 | $108,309 | $344,274 |
| 2021 | $45,066 | $367,377 | $108,309 | $259,068 |
| 2020 | $38,492 | $406,990 | $108,309 | $298,681 |
| 2019 | $36,910 | $397,835 | $108,309 | $289,526 |
| 2018 | $42,599 | $361,857 | $108,309 | $253,548 |
| 2017 | $40,755 | $362,133 | $108,310 | $253,823 |
| 2016 | $38,563 | $341,521 | $108,309 | $233,212 |
| 2015 | $7,834 | $310,374 | $108,309 | $202,065 |
| 2014 | $7,834 | $292,930 | $108,309 | $184,621 |
Source: Public Records
Map
Nearby Homes
- 652 Broadway Unit 5
- 77 Bleecker St Unit 614
- 77 Bleecker St Unit 123E
- 77 Bleecker St Unit 316
- 77 Bleecker St Unit 1011
- 77 Bleecker St Unit 320
- 77 Bleecker St Unit 105
- 77 Bleecker St Unit 517
- 77 Bleecker St Unit 816
- 88 Bleecker St Unit 6A
- 19 Bond St Unit 4A
- 1 Great Jones Aly Unit 4A
- 21 Bond St Unit PH
- 200 Mercer St Unit PH4C
- 200 Mercer St Unit 1A
- 200 Mercer St Unit 4D
- 41 Bleecker St Unit 1
- 684 Broadway Unit 4E
- 684 Broadway Unit 10W
- 36 Bleecker St Unit 3C
- 1 Bond St Unit 5D
- 1 Bond St Unit 5C
- 1 Bond St Unit 6D5
- 1 Bond St Unit 4D5
- 1 Bond St Unit 3D5
- 1 Bond St Unit 2D5
- 1 Bond St Unit 6C5
- 1 Bond St Unit 4C5
- 1 Bond St Unit 3C5
- 1 Bond St Unit 2C5
- 1 Bond St Unit 6B5
- 1 Bond St Unit 5B5
- 1 Bond St Unit 4B5
- 1 Bond St Unit 3B5
- 1 Bond St Unit 2B5
- 1 Bond St Unit 6A5
- 1 Bond St Unit 5A5
- 1 Bond St Unit 4A5
- 1 Bond St Unit 2A5
- 1 Bond St Unit 2A