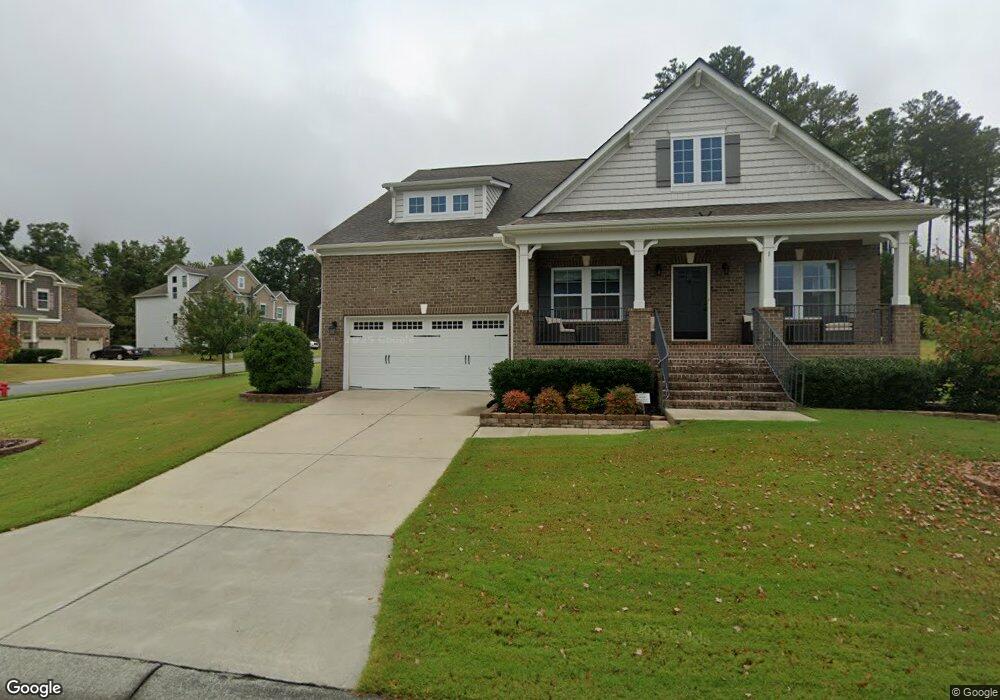
1 Bonsack Ct Durham, NC 27703
Eastern Durham NeighborhoodEstimated Value: $626,000 - $689,000
4
Beds
4
Baths
2,854
Sq Ft
$228/Sq Ft
Est. Value
About This Home
This home is located at 1 Bonsack Ct, Durham, NC 27703 and is currently estimated at $651,217, approximately $228 per square foot. 1 Bonsack Ct is a home located in Durham County with nearby schools including Spring Valley Elementary School, John W Neal Middle School, and Southern School of Energy & Sustainability.
Ownership History
Date
Name
Owned For
Owner Type
Purchase Details
Closed on
Jun 29, 2017
Sold by
Calatlantic Group Inc
Bought by
Tabb Sue Anne
Current Estimated Value
Home Financials for this Owner
Home Financials are based on the most recent Mortgage that was taken out on this home.
Original Mortgage
$397,826
Outstanding Balance
$328,575
Interest Rate
3.94%
Mortgage Type
New Conventional
Estimated Equity
$322,642
Purchase Details
Closed on
Jun 30, 2016
Sold by
Mrec Brightleaf Llc
Bought by
Calatlantic Grp Inc
Create a Home Valuation Report for This Property
The Home Valuation Report is an in-depth analysis detailing your home's value as well as a comparison with similar homes in the area
Home Values in the Area
Average Home Value in this Area
Purchase History
| Date | Buyer | Sale Price | Title Company |
|---|---|---|---|
| Tabb Sue Anne | $411,000 | None Available | |
| Calatlantic Grp Inc | $2,075,000 | -- |
Source: Public Records
Mortgage History
| Date | Status | Borrower | Loan Amount |
|---|---|---|---|
| Open | Tabb Sue Anne | $397,826 |
Source: Public Records
Tax History
| Year | Tax Paid | Tax Assessment Tax Assessment Total Assessment is a certain percentage of the fair market value that is determined by local assessors to be the total taxable value of land and additions on the property. | Land | Improvement |
|---|---|---|---|---|
| 2025 | $6,360 | $641,570 | $116,279 | $525,291 |
| 2024 | $5,199 | $372,739 | $66,542 | $306,197 |
| 2023 | $4,883 | $372,739 | $66,542 | $306,197 |
| 2022 | $4,771 | $372,739 | $66,542 | $306,197 |
| 2021 | $4,748 | $372,739 | $66,542 | $306,197 |
| 2020 | $4,637 | $372,739 | $66,542 | $306,197 |
| 2019 | $4,637 | $372,739 | $66,542 | $306,197 |
| 2018 | $4,389 | $323,558 | $68,600 | $254,958 |
| 2017 | $924 | $68,600 | $68,600 | $0 |
| 2016 | $893 | $68,600 | $68,600 | $0 |
| 2015 | $1,277 | $92,249 | $92,249 | $0 |
| 2014 | $1,277 | $92,249 | $92,249 | $0 |
Source: Public Records
Map
Nearby Homes
- 1020 Constellation Cir
- 1821 S Mineral Springs Rd
- 3105 Ranger Dr
- 3112 Ranger Dr
- 1948 Hinesley Dr
- 1950 Hinesley Dr
- 1944 Hinesley Dr
- 1942 Hinesley Dr
- 1936 Hinesley Dr
- 1940 Hinesley Dr
- 1938 Hinesley Dr
- 1932 Hinesley Dr
- 1934 Hinesley Dr
- 1602 Eagle Lodge Ln
- 1946 Hinesley Dr
- 1931 Hinesley Dr
- 1937 Hinesley Dr
- 1935 Hinesley Dr
- 1939 Hinesley Dr
- 1611 Eagle Lodge Ln
- 3 Bonsack Ct
- 1913 Pattersons Mill Rd
- 1923 Pattersons Mill Rd
- 1918 Pattersons Mill Rd
- 1920 Pattersons Mill Rd
- 5 Bonsack Ct
- 1916 Pattersons Mill Rd
- 1911 Pattersons Mill Rd
- 1914 Pattersons Mill Rd
- 1 Horton Grove Ct
- 4 Bonsack Ct
- 3 Horton Grove Ct
- 3 Horton Grove
- 7 Bonsack Ct
- 6 Bonsack
- 1909 Pattersons Mill Rd
- 1924 Pattersons Mill Rd
- 1924 Patterson's Mill Rd
- 1912 Pattersons Mill Rd
- 8 Bonsack Ct
Your Personal Tour Guide
Ask me questions while you tour the home.