Estimated Value: $350,000 - $376,000
4
Beds
3
Baths
3,084
Sq Ft
$117/Sq Ft
Est. Value
About This Home
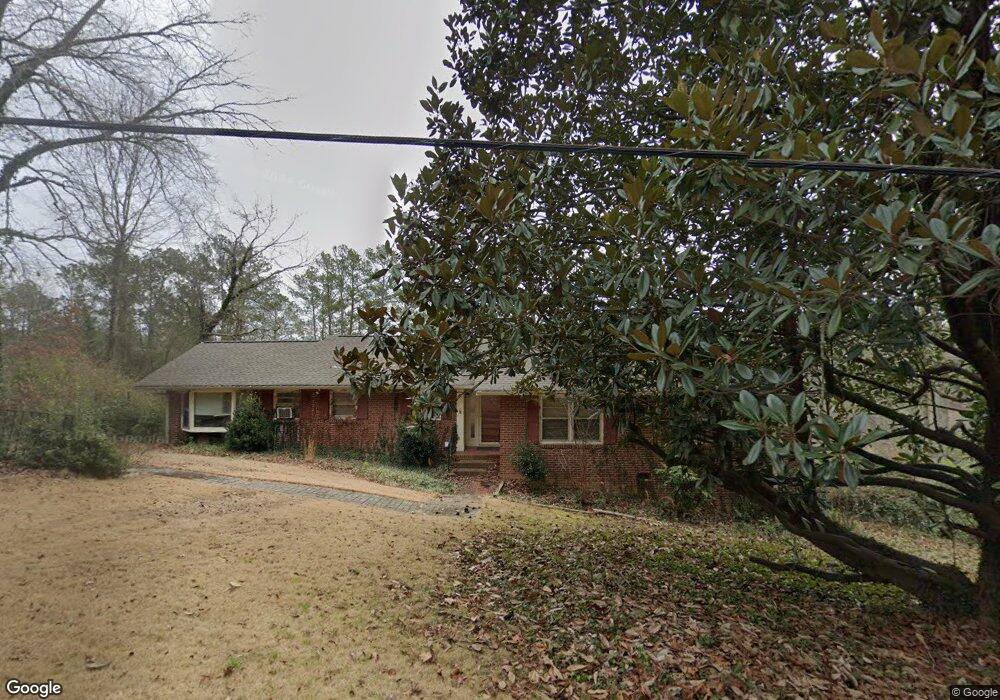
This home is located at 1 Briarcliff Rd SE, Rome, GA 30161 and is currently estimated at $360,194, approximately $116 per square foot. 1 Briarcliff Rd SE is a home located in Floyd County with nearby schools including Dan McCarty Middle School, Rome High School, and St. Mary School.
Ownership History
Date
Name
Owned For
Owner Type
Purchase Details
Closed on
Feb 17, 2021
Sold by
Lynn Leah B
Bought by
Belk Thomas Lee
Current Estimated Value
Home Financials for this Owner
Home Financials are based on the most recent Mortgage that was taken out on this home.
Original Mortgage
$186,900
Outstanding Balance
$167,162
Interest Rate
2.7%
Mortgage Type
New Conventional
Estimated Equity
$193,033
Purchase Details
Closed on
May 24, 2018
Sold by
Metzger Trevor A
Bought by
Chance Lynn Leah B and Chance Lynn Leonard
Home Financials for this Owner
Home Financials are based on the most recent Mortgage that was taken out on this home.
Original Mortgage
$173,794
Interest Rate
5.5%
Mortgage Type
FHA
Purchase Details
Closed on
Feb 27, 2009
Bought by
P and R
Purchase Details
Closed on
Mar 8, 2001
Sold by
Wilkinson Wallace and Wilkinson Vera P
Bought by
Wilkinson Vera P
Purchase Details
Closed on
Jul 13, 1989
Bought by
Wilkinson Wallace and Wilkinson Vera P
Create a Home Valuation Report for This Property
The Home Valuation Report is an in-depth analysis detailing your home's value as well as a comparison with similar homes in the area
Home Values in the Area
Average Home Value in this Area
Purchase History
| Date | Buyer | Sale Price | Title Company |
|---|---|---|---|
| Belk Thomas Lee | $210,000 | -- | |
| Chance Lynn Leah B | $177,000 | -- | |
| P | -- | -- | |
| Wilkinson Vera P | -- | -- | |
| Wilkinson Wallace | -- | -- |
Source: Public Records
Mortgage History
| Date | Status | Borrower | Loan Amount |
|---|---|---|---|
| Open | Belk Thomas Lee | $186,900 | |
| Previous Owner | Chance Lynn Leah B | $173,794 |
Source: Public Records
Tax History Compared to Growth
Tax History
| Year | Tax Paid | Tax Assessment Tax Assessment Total Assessment is a certain percentage of the fair market value that is determined by local assessors to be the total taxable value of land and additions on the property. | Land | Improvement |
|---|---|---|---|---|
| 2024 | $4,804 | $125,684 | $8,617 | $117,067 |
| 2023 | $4,451 | $116,253 | $7,834 | $108,419 |
| 2022 | $3,065 | $96,914 | $6,463 | $90,451 |
| 2021 | $3,047 | $88,387 | $6,463 | $81,924 |
| 2020 | $2,977 | $82,995 | $4,896 | $78,099 |
| 2019 | $2,573 | $79,038 | $4,896 | $74,142 |
| 2018 | $2,773 | $80,693 | $4,896 | $75,797 |
| 2017 | $2,686 | $75,640 | $4,896 | $70,744 |
| 2016 | $2,669 | $74,280 | $4,880 | $69,400 |
| 2015 | $2,463 | $71,507 | $4,880 | $66,627 |
| 2014 | $2,463 | $71,507 | $4,880 | $66,627 |
Source: Public Records
Map
Nearby Homes
- 14 Gables Dr SE
- 46 Turnbull Dr SE
- 7 Crestview Ln SE
- 12 Turnbull Dr SE
- 1 Vassar Dr SE
- 9 Richland Ct SE
- 0 Turnbull Dr SE Unit 10570009
- 13 Townview Rd SE
- 2512 Callier Springs Rd SE
- 1314 E 2nd Ave SE
- 415 E 10th St SE
- 1 Joe Louis Blvd SE
- 525 E 14th St SW
- 74 Dodd Blvd SE
- 31 Notasulga Dr SW
- 9 Eastridge Ct SW
- 93 Dodd Blvd SE
- 95 Dodd Blvd SE
- 414 E 17th St SW
- 4 E 15th St SW
- 3 Briarcliff Rd SE
- 3 Briarcliff Rd SE
- 3 Briarcliff Rd SE
- 3 Briarcliff Rd SE
- 0 Briarcliff Rd SE Unit LOT 10 2978525
- 0 Briarcliff Rd SE Unit 7401835
- 0 Briarcliff Rd SE Unit 10 7496462
- 0 Briarcliff Rd SE
- 1 Riverview Rd SE
- 2 Briarcliff Rd SE
- 6 Briarcliff Rd SE
- 6 Briarcliff Rd SE
- 6 Briarcliff Rd SE
- 14 Lenox Cir SE
- 22 Gables Dr SE
- 20 Gables Dr SE
- 16 Gables Dr SE
- 8 Riverview Rd SE
- 10 Lenox Cir SE
- 24 Gables Dr SE Unit 52