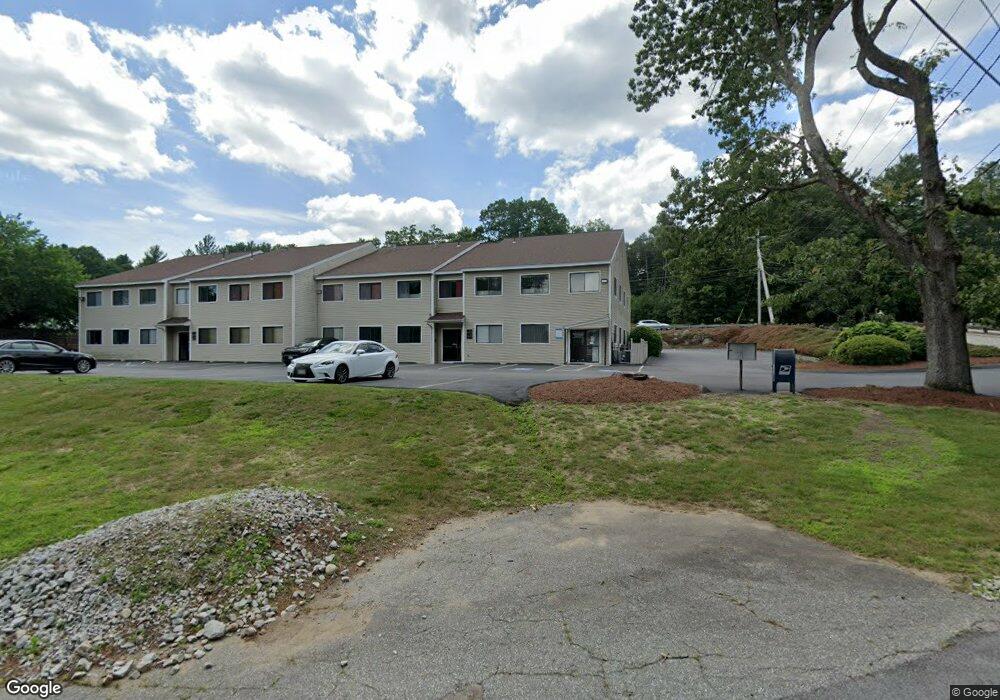
1 Bridgeview Cir Unit 2+4 Tyngsboro, MA 01879
Estimated Value: $175,844
--
Bed
1
Bath
900
Sq Ft
$195/Sq Ft
Est. Value
About This Home
This home is located at 1 Bridgeview Cir Unit 2+4, Tyngsboro, MA 01879 and is currently estimated at $175,844, approximately $195 per square foot. 1 Bridgeview Cir Unit 2+4 is a home located in Middlesex County with nearby schools including Tyngsborough Elementary School, Tyngsborough Middle School, and Tyngsborough High School.
Ownership History
Date
Name
Owned For
Owner Type
Purchase Details
Closed on
Aug 2, 2016
Sold by
Int Bridgewview
Bought by
Encl Rt
Current Estimated Value
Purchase Details
Closed on
Aug 17, 2012
Sold by
Bridgeview Mortgage Co
Bought by
Bridgeview Invst Rt
Purchase Details
Closed on
Mar 26, 2012
Sold by
Boemler Karen
Bought by
Bridgeview Mortgage Co
Purchase Details
Closed on
Jul 3, 2008
Sold by
Bridgeview Mtg Co Inc
Bought by
Boemler Karen
Home Financials for this Owner
Home Financials are based on the most recent Mortgage that was taken out on this home.
Original Mortgage
$83,183
Interest Rate
6.01%
Mortgage Type
Commercial
Purchase Details
Closed on
Jun 28, 2007
Sold by
Doyle Jacqueline and Doyle Thomas
Bought by
Savary Eileen F
Purchase Details
Closed on
May 5, 2006
Sold by
Pubsnet Inc
Bought by
Doyle Jacqueline and Doyle Thomas
Create a Home Valuation Report for This Property
The Home Valuation Report is an in-depth analysis detailing your home's value as well as a comparison with similar homes in the area
Home Values in the Area
Average Home Value in this Area
Purchase History
| Date | Buyer | Sale Price | Title Company |
|---|---|---|---|
| Encl Rt | $95,000 | -- | |
| Bridgeview Invst Rt | $88,500 | -- | |
| Bridgeview Mortgage Co | $168,000 | -- | |
| Boemler Karen | $168,000 | -- | |
| Boemler Karen | $168,000 | -- | |
| Savary Eileen F | $130,000 | -- | |
| Doyle Jacqueline | $100,000 | -- |
Source: Public Records
Mortgage History
| Date | Status | Borrower | Loan Amount |
|---|---|---|---|
| Previous Owner | Boemler Karen | $83,183 |
Source: Public Records
Tax History Compared to Growth
Tax History
| Year | Tax Paid | Tax Assessment Tax Assessment Total Assessment is a certain percentage of the fair market value that is determined by local assessors to be the total taxable value of land and additions on the property. | Land | Improvement |
|---|---|---|---|---|
| 2025 | $11 | $91,500 | $0 | $91,500 |
| 2024 | $1,149 | $90,300 | $0 | $90,300 |
| 2023 | $1,168 | $82,600 | $0 | $82,600 |
| 2022 | $1,140 | $76,300 | $0 | $76,300 |
| 2021 | $1,864 | $70,200 | $0 | $70,200 |
| 2020 | $692 | $43,900 | $0 | $43,900 |
| 2019 | $769 | $45,400 | $0 | $45,400 |
| 2018 | $777 | $45,400 | $0 | $45,400 |
| 2017 | $726 | $42,300 | $0 | $42,300 |
| 2016 | $767 | $43,700 | $0 | $43,700 |
| 2015 | $741 | $43,700 | $0 | $43,700 |
Source: Public Records
Map
Nearby Homes
- 5 Bridgeview Cir Unit 22
- 123 Sherburne Ave
- 111 Sherburne Ave
- 109 Sherburne Ave
- 44 Shakespeare St
- 24 Old Tyng Rd
- 10 Dickens Ln
- 48 Mission Rd
- 5 Mission Rd Unit 203
- 1 Hope St
- 915 Wellman Ave Unit 915
- 28 Juniper Ln Unit 65
- 11 Juniper Ln Unit 14
- 32 Juniper Ln Unit 61
- 43 Juniper Ln Unit 30
- 17 Juniper Ln Unit 17
- 20 Juniper Ln Unit 67
- 22 Juniper Ln Unit 66
- 52 Pawtucket Blvd Unit 21
- 26 Juniper Ln Unit 64
- 1 Bridgeview Cir Unit 10
- 1 Bridgeview Cir Unit 15
- 1 Bridgeview Cir Unit 13
- 1 Bridgeview Cir Unit 15
- 1 Bridgeview Cir Unit 13
- 1 Bridgeview Cir Unit 9
- 1 Bridgeview Cir Unit 3
- 1 Bridgeview Cir Unit 13 & 15A
- 1 Bridgeview Cir
- 47 Middlesex Rd
- 5 Bridgeview Park #18 Unit 18,5
- 50 Bridgeview Cir Unit 50 3
- 5 Bridgeview Cir Unit 9
- 5 Bridgeview Cir Unit 8
- 5 Bridgeview Cir Unit 7
- 5 Bridgeview Cir Unit 6
- 5 Bridgeview Cir
- 5 Bridgeview Cir Unit 4
- 5 Bridgeview Cir Unit 3
- 5 Bridgeview Cir Unit 24