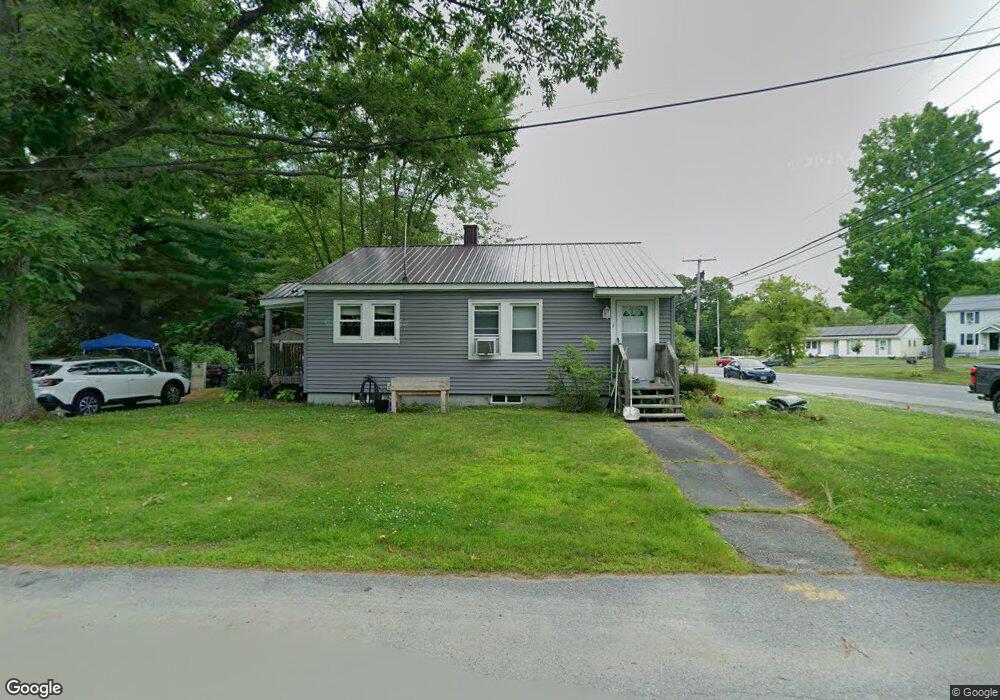
1 Brightwood St Waterville, ME 04901
Estimated Value: $187,233 - $222,000
2
Beds
1
Bath
878
Sq Ft
$234/Sq Ft
Est. Value
About This Home
This home is located at 1 Brightwood St, Waterville, ME 04901 and is currently estimated at $205,558, approximately $234 per square foot. 1 Brightwood St is a home located in Kennebec County with nearby schools including George J. Mitchell School, Albert S. Hall School, and Waterville Junior High School.
Ownership History
Date
Name
Owned For
Owner Type
Purchase Details
Closed on
Nov 7, 2011
Sold by
Department Of Housing & Urban Dev
Bought by
Dubois Danny P and Wacome Anita R
Current Estimated Value
Purchase Details
Closed on
Aug 24, 2011
Sold by
Waterville Town Of
Bought by
Department Of Housing & Urban Dev
Purchase Details
Closed on
Jul 13, 2011
Sold by
Maine State Housing Auth
Bought by
Department Of Housing & Urban Dev
Purchase Details
Closed on
Aug 22, 2007
Sold by
Waterville Town Of
Bought by
Symonevich Brian
Create a Home Valuation Report for This Property
The Home Valuation Report is an in-depth analysis detailing your home's value as well as a comparison with similar homes in the area
Home Values in the Area
Average Home Value in this Area
Purchase History
| Date | Buyer | Sale Price | Title Company |
|---|---|---|---|
| Dubois Danny P | $50,000 | -- | |
| Department Of Housing & Urban Dev | -- | -- | |
| Department Of Housing & Urban Dev | -- | -- | |
| Symonevich Brian M | -- | -- | |
| Symonevich Brian | -- | -- |
Source: Public Records
Tax History Compared to Growth
Tax History
| Year | Tax Paid | Tax Assessment Tax Assessment Total Assessment is a certain percentage of the fair market value that is determined by local assessors to be the total taxable value of land and additions on the property. | Land | Improvement |
|---|---|---|---|---|
| 2025 | $2,436 | $143,300 | $24,500 | $118,800 |
| 2024 | $2,310 | $115,500 | $18,900 | $96,600 |
| 2023 | $2,298 | $115,500 | $18,900 | $96,600 |
| 2022 | $1,957 | $75,700 | $14,200 | $61,500 |
| 2021 | $1,930 | $75,700 | $14,200 | $61,500 |
| 2020 | $1,950 | $75,700 | $14,200 | $61,500 |
| 2019 | $1,950 | $75,700 | $14,200 | $61,500 |
| 2018 | $1,913 | $75,700 | $14,200 | $61,500 |
| 2017 | $1,766 | $75,700 | $14,200 | $61,500 |
| 2016 | $1,726 | $75,700 | $14,200 | $61,500 |
| 2015 | $1,460 | $52,500 | $16,300 | $36,200 |
| 2014 | $1,439 | $52,500 | $16,300 | $36,200 |
| 2013 | $1,439 | $52,500 | $16,300 | $36,200 |
Source: Public Records
Map
Nearby Homes