1 Bromfield Ct Unit D Newburyport, MA 01950
About This Home
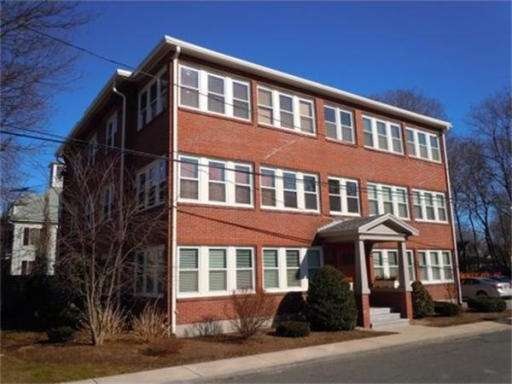
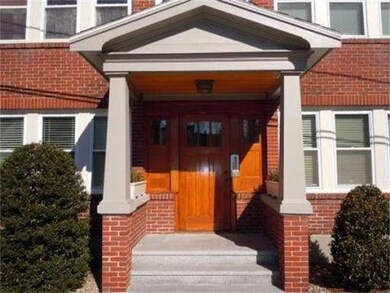
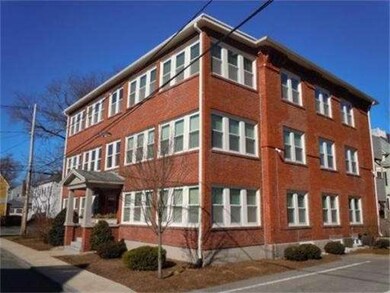
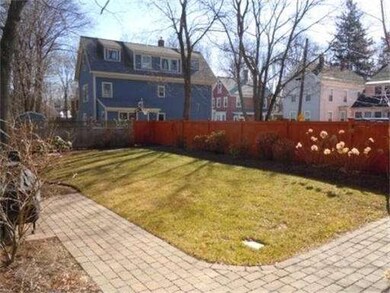
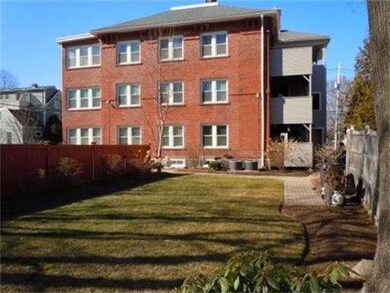
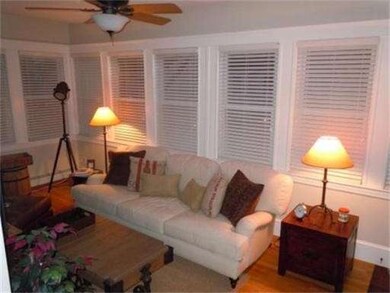
As of November 2022Open House Sunday 2/19 12-2pm, Highly sought after converted school house in a great South End walk everywhere location. Bike ride to beach out to Plum Island to enjoy the sun and sand for a swim, then out to Downtown Newburyport for Dinner,It is a lifestyle! Central AC, large deck overlooking share yard space located on a dead end street this unit is light and bright facing South East. Kitchen has walnut cabinets, granite, stainless and full size in unit laudry. Open Sunday 12-2!
Property Details
Home Type
Condominium
Est. Annual Taxes
$5,019
Year Built
1884
Lot Details
0
Listing Details
- Unit Level: 2
- Unit Placement: End
- Special Features: None
- Property Sub Type: Condos
- Year Built: 1884
Interior Features
- Has Basement: Yes
- Primary Bathroom: Yes
- Number of Rooms: 5
- Electric: 100 Amps
- Energy: Insulated Windows, Insulated Doors, Storm Doors
- Flooring: Wood
- Insulation: Full
- Interior Amenities: Cable Available, Intercom
- Bedroom 2: First Floor, 10X12
- Bathroom #1: First Floor
- Bathroom #2: First Floor
- Kitchen: First Floor, 20X9
- Laundry Room: First Floor
- Living Room: First Floor, 19X10
- Master Bedroom: First Floor, 12X18
- Master Bedroom Description: Hard Wood Floor
- Dining Room: First Floor, 12X14
Exterior Features
- Construction: Brick
- Exterior Unit Features: Deck - Composite
Garage/Parking
- Parking: Off-Street, Tandem
- Parking Spaces: 2
Utilities
- Cooling Zones: 1
- Heat Zones: 1
- Hot Water: Natural Gas
- Utility Connections: for Gas Range, for Gas Oven, Washer Hookup, Icemaker Connection
Condo/Co-op/Association
- Association Fee Includes: Heat, Hot Water, Water, Sewer, Master Insurance, Exterior Maintenance, Landscaping, Snow Removal
- Association Pool: No
- Management: Professional - Off Site
- Pets Allowed: Yes w/ Restrictions (See Remarks)
- No Units: 6
- Unit Building: D
Ownership History
Purchase Details
Home Financials for this Owner
Home Financials are based on the most recent Mortgage that was taken out on this home.Purchase Details
Home Financials for this Owner
Home Financials are based on the most recent Mortgage that was taken out on this home.Purchase Details
Home Financials for this Owner
Home Financials are based on the most recent Mortgage that was taken out on this home.Similar Homes in Newburyport, MA
Home Values in the Area
Average Home Value in this Area
Purchase History
| Date | Type | Sale Price | Title Company |
|---|---|---|---|
| Not Resolvable | $325,000 | -- | |
| Deed | $290,000 | -- | |
| Deed | $349,900 | -- |
Mortgage History
| Date | Status | Loan Amount | Loan Type |
|---|---|---|---|
| Open | $334,900 | Purchase Money Mortgage | |
| Closed | $70,000 | New Conventional | |
| Previous Owner | $223,500 | No Value Available | |
| Previous Owner | $220,000 | Purchase Money Mortgage | |
| Previous Owner | $279,920 | Purchase Money Mortgage |
Property History
| Date | Event | Price | Change | Sq Ft Price |
|---|---|---|---|---|
| 11/15/2022 11/15/22 | Sold | $549,900 | 0.0% | $565 / Sq Ft |
| 09/25/2022 09/25/22 | Pending | -- | -- | -- |
| 09/21/2022 09/21/22 | For Sale | $549,900 | +69.2% | $565 / Sq Ft |
| 04/12/2012 04/12/12 | Sold | $325,000 | -3.2% | $334 / Sq Ft |
| 03/11/2012 03/11/12 | Pending | -- | -- | -- |
| 02/15/2012 02/15/12 | For Sale | $335,900 | -- | $345 / Sq Ft |
Tax History Compared to Growth
Tax History
| Year | Tax Paid | Tax Assessment Tax Assessment Total Assessment is a certain percentage of the fair market value that is determined by local assessors to be the total taxable value of land and additions on the property. | Land | Improvement |
|---|---|---|---|---|
| 2025 | $5,019 | $523,900 | $0 | $523,900 |
| 2024 | $4,960 | $497,500 | $0 | $497,500 |
| 2023 | $4,744 | $441,700 | $0 | $441,700 |
| 2022 | $4,636 | $386,000 | $0 | $386,000 |
| 2021 | $4,607 | $364,500 | $0 | $364,500 |
| 2020 | $4,643 | $361,600 | $0 | $361,600 |
| 2019 | $4,535 | $346,700 | $0 | $346,700 |
| 2018 | $4,512 | $340,300 | $0 | $340,300 |
| 2017 | $4,428 | $329,200 | $0 | $329,200 |
| 2016 | $4,214 | $314,700 | $0 | $314,700 |
| 2015 | $4,061 | $304,400 | $0 | $304,400 |
Agents Affiliated with this Home
-

Seller's Agent in 2022
Robert Bentley
RE/MAX
(781) 858-5115
116 in this area
170 Total Sales
-

Buyer's Agent in 2022
Lela Wright
RE/MAX
(978) 815-6690
31 in this area
44 Total Sales
Map
Source: MLS Property Information Network (MLS PIN)
MLS Number: 71339266
APN: NEWP-000024-000058-D000000
- 65 Bromfield St
- 129 Prospect St
- 12 Lunt St
- 8 Parsons St
- 8 Parsons St Unit 8
- 78 Purchase St
- 5 High Rd
- 11 High Rd
- 10 B Milk St Unit 1
- 8A Milk St Unit 1
- 164 Water St
- 166 Water St Unit 166
- 19 Beck St
- 22 Beacon Ave Unit 1
- 226 Water St
- 5-13 Lime St Unit 2
- 129 Water St
- 42 Federal St Unit B
- 6 Orange St Unit 7
- 1 Fruit St
