Estimated Value: $252,016 - $303,000
--
Bed
2
Baths
2,091
Sq Ft
$131/Sq Ft
Est. Value
About This Home
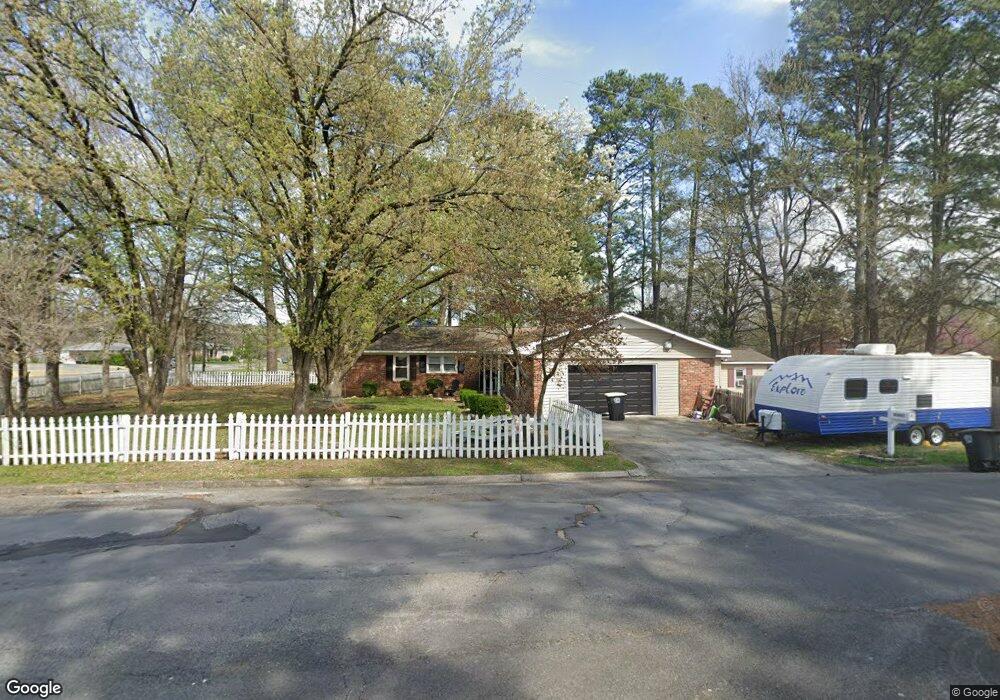
This home is located at 1 Brookcrest Dr SW Unit 3, Rome, GA 30165 and is currently estimated at $274,754, approximately $131 per square foot. 1 Brookcrest Dr SW Unit 3 is a home located in Floyd County with nearby schools including Rome High School and Darlington School.
Ownership History
Date
Name
Owned For
Owner Type
Purchase Details
Closed on
Nov 15, 2019
Sold by
Colston Sue
Bought by
Vaughn Taylor J and Vaughn Ashleigh N
Current Estimated Value
Home Financials for this Owner
Home Financials are based on the most recent Mortgage that was taken out on this home.
Original Mortgage
$163,186
Outstanding Balance
$144,010
Interest Rate
4.12%
Mortgage Type
FHA
Estimated Equity
$130,744
Purchase Details
Closed on
Oct 31, 2016
Bought by
Solston Sue
Purchase Details
Closed on
Nov 7, 2005
Sold by
Alexander Thomas E
Bought by
Alexander Thomas E
Home Financials for this Owner
Home Financials are based on the most recent Mortgage that was taken out on this home.
Original Mortgage
$92,137
Interest Rate
5.9%
Mortgage Type
VA
Purchase Details
Closed on
Jan 24, 1986
Bought by
Alexander Thomas E and Alexander Donna D
Create a Home Valuation Report for This Property
The Home Valuation Report is an in-depth analysis detailing your home's value as well as a comparison with similar homes in the area
Home Values in the Area
Average Home Value in this Area
Purchase History
| Date | Buyer | Sale Price | Title Company |
|---|---|---|---|
| Vaughn Taylor J | $166,200 | -- | |
| Solston Sue | $131,500 | -- | |
| Cartus Financial Corp | $131,500 | -- | |
| Alexander Thomas E | $160,000 | -- | |
| Alexander Thomas E | $70,000 | -- |
Source: Public Records
Mortgage History
| Date | Status | Borrower | Loan Amount |
|---|---|---|---|
| Open | Vaughn Taylor J | $163,186 | |
| Previous Owner | Alexander Thomas E | $92,137 |
Source: Public Records
Tax History Compared to Growth
Tax History
| Year | Tax Paid | Tax Assessment Tax Assessment Total Assessment is a certain percentage of the fair market value that is determined by local assessors to be the total taxable value of land and additions on the property. | Land | Improvement |
|---|---|---|---|---|
| 2024 | $2,841 | $96,884 | $14,400 | $82,484 |
| 2023 | $2,821 | $93,115 | $12,800 | $80,315 |
| 2022 | $2,578 | $77,876 | $10,400 | $67,476 |
| 2021 | $2,513 | $71,738 | $10,400 | $61,338 |
| 2020 | $2,438 | $66,636 | $8,000 | $58,636 |
| 2019 | $1,968 | $55,708 | $8,000 | $47,708 |
| 2018 | $1,927 | $53,326 | $8,000 | $45,326 |
| 2017 | $1,871 | $50,538 | $8,000 | $42,538 |
| 2016 | $2,056 | $55,360 | $8,000 | $47,360 |
| 2015 | $1,999 | $56,040 | $8,000 | $48,040 |
| 2014 | $1,999 | $57,006 | $8,000 | $49,006 |
Source: Public Records
Map
Nearby Homes
- 107 E Clinton Dr SW
- 0 Cedartown Rd Unit 10479932
- 43 Westwood Cir SW
- 31 Southfork Dr
- 16 Jefferson Dr SW
- 0 Brookvalley Ct SW Unit 7512814
- 0 Brookvalley Ct SW Unit 10444714
- 40 Hawk Spring Dr SW
- 0 E Clinton Dr SW Unit 7497950
- 0 E Clinton Dr SW Unit 10427155
- 28 Southfork Dr
- 26 Jefferson Dr SW
- 22 Southfork Dr SW
- 216 Coosawattee Ave SW
- 25 Ridge Dr SW
- 0 Leafmore Rd SW Unit 10562671
- 207 Paris Dr SW
- 358A&B Leafmore Rd SW
- 200 Coosawattee Ave SW
- 15 John Ross Dr SW
- 1 Brookcrest Dr SW
- 223 Burnett Ferry Rd SW
- 1 E Creekview Dr SW
- 301 Burnett Ferry Rd SW
- 3 E Creekview Dr SW
- 221 Burnett Ferry Rd SW
- 2 W Creekview Dr SW
- 303 Burnett Ferry Rd SW
- 1234 Brooke Cir
- W W Creekview Dr
- 4 W Creekview Dr SW
- 5 E Creekview Dr SW
- 2 E Creekview Dr SW
- 219 Burnett Ferry Rd SW
- 3 Wood Valley Dr SW
- 5 Wood Valley Dr SW
- 7 Wood Valley Dr SW
- 222 Burnett Ferry Rd SW
- 6 W Creekview Dr SW
- 217 Burnett Ferry Rd SW