1 C St Unit K Westport, MA 02790
North Westport NeighborhoodEstimated Value: $400,597 - $476,000
2
Beds
--
Bath
864
Sq Ft
$501/Sq Ft
Est. Value
About This Home
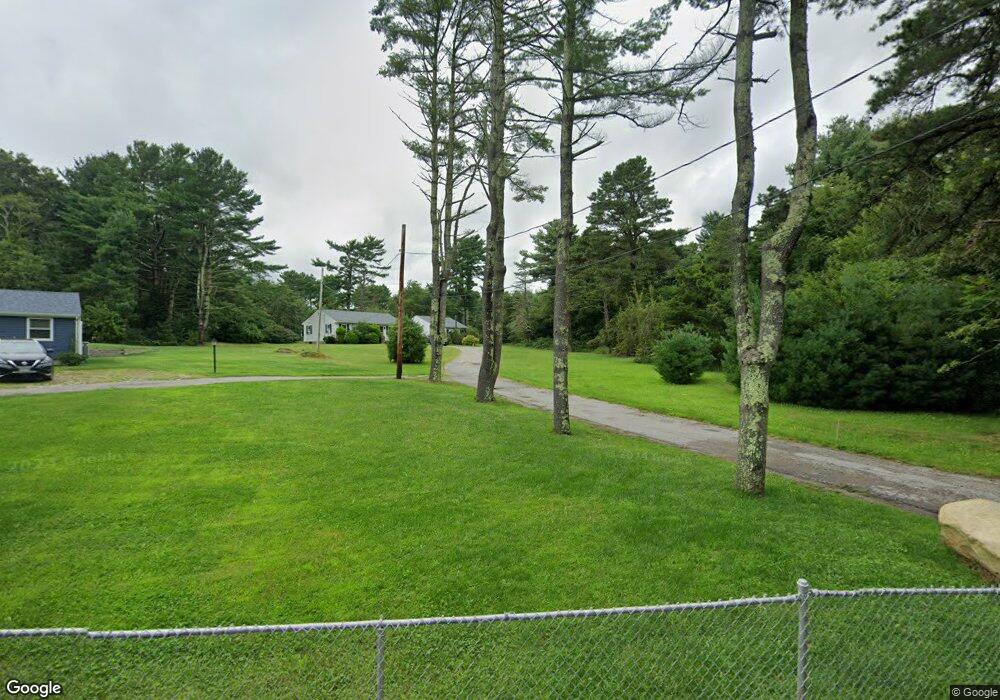
This home is located at 1 C St Unit K, Westport, MA 02790 and is currently estimated at $432,899, approximately $501 per square foot. 1 C St Unit K is a home located in Bristol County with nearby schools including Alice A. Macomber Primary School, Westport Elementary School, and Westport Middle-High School.
Ownership History
Date
Name
Owned For
Owner Type
Purchase Details
Closed on
Aug 1, 2006
Sold by
Bigelow Brandon J and Leverett Christine A
Bought by
Bigelow Brandon J and Bigelow Christine A
Current Estimated Value
Home Financials for this Owner
Home Financials are based on the most recent Mortgage that was taken out on this home.
Original Mortgage
$221,900
Outstanding Balance
$132,573
Interest Rate
6.67%
Mortgage Type
Purchase Money Mortgage
Estimated Equity
$300,326
Create a Home Valuation Report for This Property
The Home Valuation Report is an in-depth analysis detailing your home's value as well as a comparison with similar homes in the area
Home Values in the Area
Average Home Value in this Area
Purchase History
| Date | Buyer | Sale Price | Title Company |
|---|---|---|---|
| Bigelow Brandon J | -- | -- |
Source: Public Records
Mortgage History
| Date | Status | Borrower | Loan Amount |
|---|---|---|---|
| Open | Bigelow Brandon J | $221,900 | |
| Previous Owner | Bigelow Brandon J | $175,200 | |
| Previous Owner | Bigelow Brandon J | $282,300 | |
| Previous Owner | Bigelow Brandon J | $15,000 |
Source: Public Records
Tax History Compared to Growth
Tax History
| Year | Tax Paid | Tax Assessment Tax Assessment Total Assessment is a certain percentage of the fair market value that is determined by local assessors to be the total taxable value of land and additions on the property. | Land | Improvement |
|---|---|---|---|---|
| 2025 | $2,420 | $324,800 | $179,200 | $145,600 |
| 2024 | $2,338 | $302,400 | $158,800 | $143,600 |
| 2023 | $2,255 | $276,400 | $144,400 | $132,000 |
| 2022 | $2,176 | $256,600 | $144,400 | $112,200 |
| 2021 | $2,052 | $238,100 | $125,000 | $113,100 |
| 2020 | $1,965 | $233,100 | $120,000 | $113,100 |
| 2019 | $1,948 | $235,500 | $120,000 | $115,500 |
| 2018 | $1,717 | $210,200 | $125,000 | $85,200 |
| 2017 | $1,678 | $210,500 | $125,000 | $85,500 |
| 2016 | $1,629 | $206,000 | $125,000 | $81,000 |
| 2015 | $1,549 | $195,300 | $125,000 | $70,300 |
Source: Public Records
Map
Nearby Homes