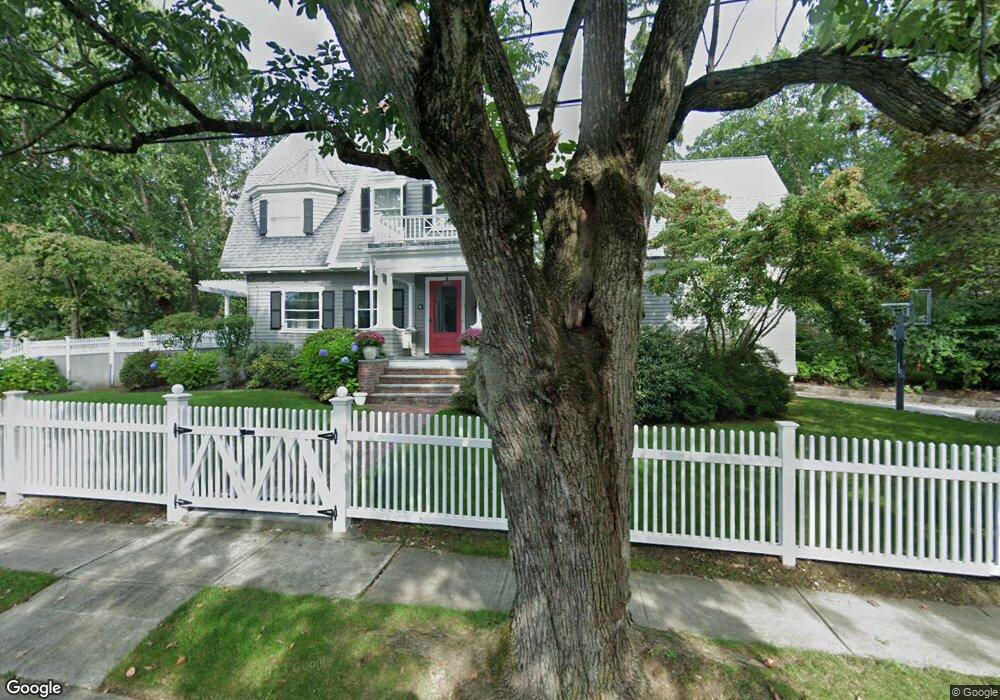
1 Calumet Rd Winchester, MA 01890
The Flats NeighborhoodEstimated Value: $2,463,770 - $2,908,000
6
Beds
4
Baths
3,806
Sq Ft
$702/Sq Ft
Est. Value
About This Home
This home is located at 1 Calumet Rd, Winchester, MA 01890 and is currently estimated at $2,673,693, approximately $702 per square foot. 1 Calumet Rd is a home located in Middlesex County with nearby schools including Lynch Elementary School, McCall Middle School, and Winchester High School.
Ownership History
Date
Name
Owned For
Owner Type
Purchase Details
Closed on
Jun 28, 2022
Sold by
Grassey Gary T
Bought by
Gary T Grassey Ft
Current Estimated Value
Purchase Details
Closed on
Jun 5, 1997
Sold by
Kalt Joseph P and Gans Judith K
Bought by
Grassey Gart T and Grassey Tara C
Create a Home Valuation Report for This Property
The Home Valuation Report is an in-depth analysis detailing your home's value as well as a comparison with similar homes in the area
Home Values in the Area
Average Home Value in this Area
Purchase History
| Date | Buyer | Sale Price | Title Company |
|---|---|---|---|
| Gary T Grassey Ft | -- | None Available | |
| Grassey Gary T | -- | None Available | |
| Grassey Gart T | $585,000 | -- |
Source: Public Records
Mortgage History
| Date | Status | Borrower | Loan Amount |
|---|---|---|---|
| Previous Owner | Grassey Gart T | $207,000 | |
| Previous Owner | Grassey Gart T | $225,000 |
Source: Public Records
Tax History Compared to Growth
Tax History
| Year | Tax Paid | Tax Assessment Tax Assessment Total Assessment is a certain percentage of the fair market value that is determined by local assessors to be the total taxable value of land and additions on the property. | Land | Improvement |
|---|---|---|---|---|
| 2025 | $233 | $2,101,100 | $1,091,400 | $1,009,700 |
| 2024 | $22,948 | $2,025,400 | $1,059,300 | $966,100 |
| 2023 | $21,592 | $1,829,800 | $995,100 | $834,700 |
| 2022 | $21,189 | $1,693,800 | $898,800 | $795,000 |
| 2021 | $10,676 | $1,581,500 | $786,500 | $795,000 |
| 2020 | $9,953 | $1,581,500 | $786,500 | $795,000 |
| 2019 | $17,986 | $1,485,200 | $690,200 | $795,000 |
| 2018 | $17,666 | $1,449,200 | $674,100 | $775,100 |
| 2017 | $17,050 | $1,388,400 | $641,200 | $747,200 |
| 2016 | $15,937 | $1,364,500 | $641,200 | $723,300 |
| 2015 | $15,659 | $1,289,900 | $582,600 | $707,300 |
| 2014 | $15,655 | $1,236,600 | $529,700 | $706,900 |
Source: Public Records
Map
Nearby Homes
- 1 Copley St
- 104 Church St
- 4 Wyman Ct Unit 4
- 6 Wyman Ct Unit 6
- 15 Wildwood St
- 10 Sheffield Rd
- 6 Ivy Cir
- 44 Cabot St
- 2 Everett Ave
- 19 Glengarry Rd
- 53 Bacon St
- 89 Wildwood St
- 58 Bacon St
- 9 Lakeview Terrace
- 32 Woodside Rd
- 26 Swan Rd
- 36 Elmwood Ave Unit 2
- 666 Main St Unit 312
- 9 Norfolk Rd
- 62 Richardson St