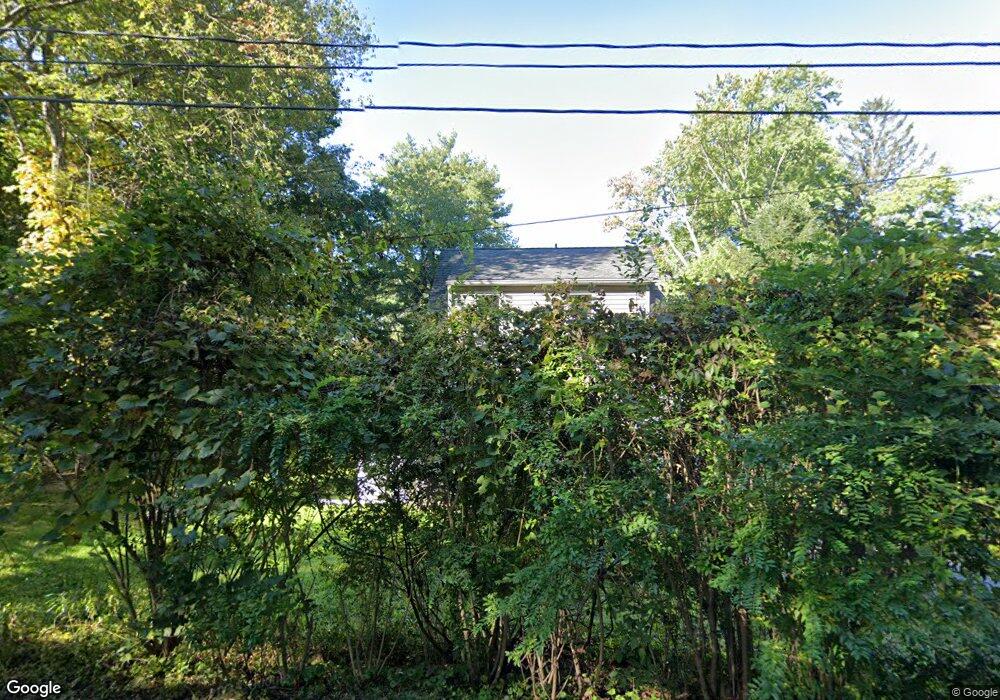
1 Calverton Dr New Fairfield, CT 06812
Estimated Value: $298,925 - $371,000
2
Beds
2
Baths
1,018
Sq Ft
$337/Sq Ft
Est. Value
About This Home
This home is located at 1 Calverton Dr, New Fairfield, CT 06812 and is currently estimated at $342,981, approximately $336 per square foot. 1 Calverton Dr is a home located in Fairfield County with nearby schools including Meeting House Hill School, New Fairfield Middle School, and New Fairfield High School.
Ownership History
Date
Name
Owned For
Owner Type
Purchase Details
Closed on
Mar 24, 2025
Sold by
Gustavson Richard and Gustavson Patricia
Bought by
Gp Residential Llc
Current Estimated Value
Purchase Details
Closed on
May 5, 1987
Sold by
Reyelt W Herbert
Bought by
Gustavson Richard
Create a Home Valuation Report for This Property
The Home Valuation Report is an in-depth analysis detailing your home's value as well as a comparison with similar homes in the area
Home Values in the Area
Average Home Value in this Area
Purchase History
| Date | Buyer | Sale Price | Title Company |
|---|---|---|---|
| Gp Residential Llc | -- | None Available | |
| Gp Residential Llc | -- | None Available | |
| Gustavson Richard | $116,000 | -- |
Source: Public Records
Mortgage History
| Date | Status | Borrower | Loan Amount |
|---|---|---|---|
| Previous Owner | Gustavson Richard | $150,000 | |
| Previous Owner | Gustavson Richard | $104,100 | |
| Previous Owner | Gustavson Richard | $105,000 | |
| Previous Owner | Gustavson Richard | $11,000 |
Source: Public Records
Tax History Compared to Growth
Tax History
| Year | Tax Paid | Tax Assessment Tax Assessment Total Assessment is a certain percentage of the fair market value that is determined by local assessors to be the total taxable value of land and additions on the property. | Land | Improvement |
|---|---|---|---|---|
| 2025 | $4,516 | $171,500 | $83,200 | $88,300 |
| 2024 | $4,463 | $122,200 | $77,500 | $44,700 |
| 2023 | $4,265 | $122,200 | $77,500 | $44,700 |
| 2022 | $3,968 | $122,200 | $77,500 | $44,700 |
| 2021 | $3,848 | $122,200 | $77,500 | $44,700 |
| 2020 | $3,737 | $122,200 | $77,500 | $44,700 |
| 2019 | $3,269 | $105,800 | $63,300 | $42,500 |
| 2018 | $3,235 | $105,800 | $63,300 | $42,500 |
| 2017 | $3,155 | $105,800 | $63,300 | $42,500 |
| 2016 | $3,034 | $105,800 | $63,300 | $42,500 |
| 2015 | $3,034 | $105,800 | $63,300 | $42,500 |
| 2014 | $3,023 | $115,900 | $70,000 | $45,900 |
Source: Public Records
Map
Nearby Homes