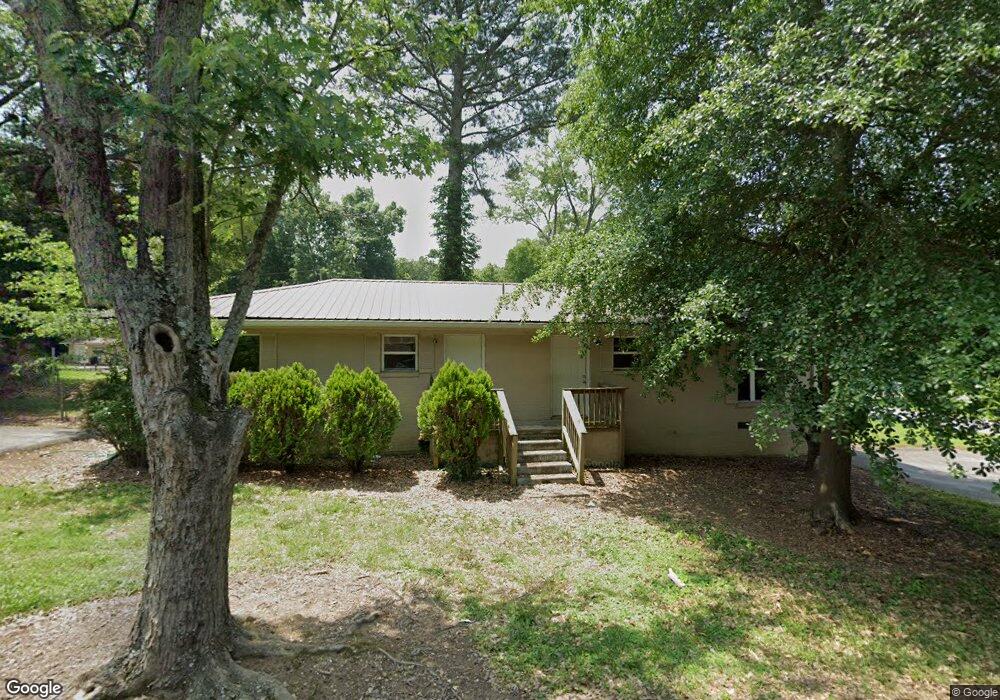
1 Carroll Ln Rossville, GA 30741
Estimated Value: $162,000 - $263,000
4
Beds
2
Baths
1,425
Sq Ft
$150/Sq Ft
Est. Value
About This Home
This home is located at 1 Carroll Ln, Rossville, GA 30741 and is currently estimated at $213,667, approximately $149 per square foot. 1 Carroll Ln is a home located in Walker County with nearby schools including Stone Creek Elementary School, Rossville Middle School, and Ridgeland High School.
Ownership History
Date
Name
Owned For
Owner Type
Purchase Details
Closed on
Apr 13, 2017
Bought by
Gsh Investments Llc
Current Estimated Value
Purchase Details
Closed on
Dec 5, 2008
Sold by
Not Provided
Bought by
Vollberg Properties Llc
Purchase Details
Closed on
Oct 24, 2008
Sold by
Not Provided
Bought by
Vollberg Properties Llc
Purchase Details
Closed on
Jul 12, 1999
Sold by
Imc Mortgage Company Inc
Bought by
J Bar D Farms Inc
Purchase Details
Closed on
May 17, 1999
Sold by
Nave Dennis V
Bought by
Imc Mortgage Company Inc
Purchase Details
Closed on
Mar 1, 1994
Sold by
American General Finance Inc
Bought by
Nave Dennis V
Purchase Details
Closed on
Jan 5, 1993
Sold by
Richardson James S and Richardson Cheryl
Bought by
American General Finance Inc
Purchase Details
Closed on
Jul 23, 1987
Sold by
Secretary Of Housing & Urban D
Bought by
Richardson James S and Richardson Cheryl
Purchase Details
Closed on
Nov 4, 1986
Sold by
Union National Bank Of Little
Bought by
Secretary Of Housing & Urban D
Create a Home Valuation Report for This Property
The Home Valuation Report is an in-depth analysis detailing your home's value as well as a comparison with similar homes in the area
Home Values in the Area
Average Home Value in this Area
Purchase History
| Date | Buyer | Sale Price | Title Company |
|---|---|---|---|
| Gsh Investments Llc | $153,000 | -- | |
| Vollberg Properties Llc | -- | -- | |
| Vollberg Properties Llc | $315,000 | -- | |
| J Bar D Farms Inc | $42,000 | -- | |
| Imc Mortgage Company Inc | $35,400 | -- | |
| Nave Dennis V | $36,000 | -- | |
| American General Finance Inc | $18,100 | -- | |
| Richardson James S | -- | -- | |
| Secretary Of Housing & Urban D | -- | -- | |
| Union National Bank Of Little | -- | -- |
Source: Public Records
Tax History Compared to Growth
Tax History
| Year | Tax Paid | Tax Assessment Tax Assessment Total Assessment is a certain percentage of the fair market value that is determined by local assessors to be the total taxable value of land and additions on the property. | Land | Improvement |
|---|---|---|---|---|
| 2024 | $2,040 | $62,492 | $2,986 | $59,506 |
| 2023 | $1,955 | $59,218 | $2,986 | $56,232 |
| 2022 | $1,340 | $50,902 | $2,986 | $47,916 |
| 2021 | $1,065 | $36,250 | $2,986 | $33,264 |
| 2020 | $904 | $29,478 | $2,986 | $26,492 |
| 2019 | $905 | $29,478 | $2,986 | $26,492 |
| 2018 | $877 | $29,478 | $2,986 | $26,492 |
| 2017 | $980 | $29,478 | $2,986 | $26,492 |
| 2016 | $813 | $29,478 | $2,986 | $26,492 |
| 2015 | $656 | $22,657 | $2,280 | $20,377 |
| 2014 | $631 | $22,657 | $2,280 | $20,377 |
| 2013 | -- | $22,656 | $2,280 | $20,376 |
Source: Public Records
Map
Nearby Homes
- 1 Carroll Ln Unit 2
- 2 Carroll Ln
- 2 Carroll Ln
- 3 Carroll Ln
- 212 E Wotring St
- 1408 Mcfarland Ave
- 201 E Wotring St Unit 12
- 201 E Wotring St
- 5 E Wotring St
- 8 Carroll Ln
- 5 Carroll Ln
- 10 Carroll Ln Unit 2
- 7 Carroll Ln
- 7 Carroll Ln Unit 2
- 3 E Wotring St
- 110 Aleda St
- 9 Carroll Ln
- 108 Aleda St
- 108 Aleda St Unit 1
- 12 Carroll Ln