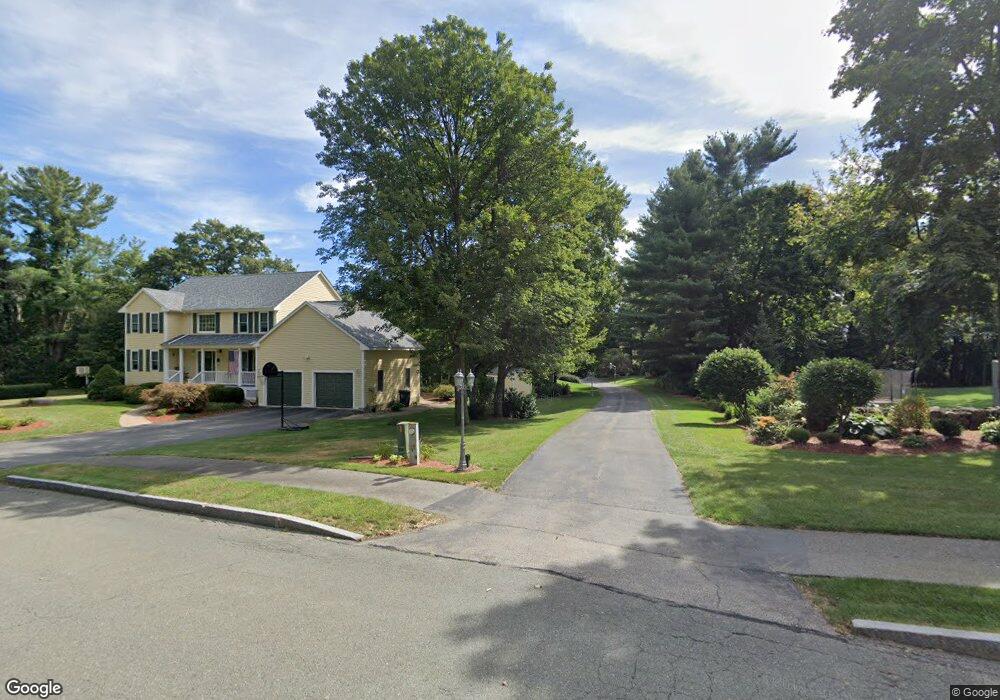
1 Castle Dr Wilmington, MA 01887
Estimated Value: $1,104,000 - $1,521,000
4
Beds
3
Baths
2,635
Sq Ft
$470/Sq Ft
Est. Value
About This Home
This home is located at 1 Castle Dr, Wilmington, MA 01887 and is currently estimated at $1,238,612, approximately $470 per square foot. 1 Castle Dr is a home located in Middlesex County with nearby schools including Wilmington Middle School, Wilmington High School, and Abundant Life Christian School and Childcare.
Ownership History
Date
Name
Owned For
Owner Type
Purchase Details
Closed on
Apr 17, 2018
Sold by
Chang John V and Chang Jean A
Bought by
Jean A Chang Ret
Current Estimated Value
Purchase Details
Closed on
Mar 1, 1995
Sold by
Marcy Rt and Lopez Mark A
Bought by
Chang John and Mcauliffe Jean
Create a Home Valuation Report for This Property
The Home Valuation Report is an in-depth analysis detailing your home's value as well as a comparison with similar homes in the area
Purchase History
| Date | Buyer | Sale Price | Title Company |
|---|---|---|---|
| Jean A Chang Ret | -- | -- | |
| Chang John | $320,000 | -- |
Source: Public Records
Mortgage History
| Date | Status | Borrower | Loan Amount |
|---|---|---|---|
| Previous Owner | Chang John | $150,000 | |
| Previous Owner | Chang John | $178,000 | |
| Previous Owner | Chang John | $193,000 | |
| Previous Owner | Chang John | $216,000 |
Source: Public Records
Tax History
| Year | Tax Paid | Tax Assessment Tax Assessment Total Assessment is a certain percentage of the fair market value that is determined by local assessors to be the total taxable value of land and additions on the property. | Land | Improvement |
|---|---|---|---|---|
| 2025 | $12,314 | $1,075,500 | $407,800 | $667,700 |
| 2024 | $12,146 | $1,062,600 | $407,800 | $654,800 |
| 2023 | $11,165 | $935,100 | $356,000 | $579,100 |
| 2022 | $10,543 | $809,100 | $297,000 | $512,100 |
| 2021 | $10,737 | $775,800 | $281,600 | $494,200 |
| 2020 | $10,478 | $771,600 | $281,600 | $490,000 |
| 2019 | $10,269 | $746,800 | $268,100 | $478,700 |
| 2018 | $10,122 | $702,400 | $255,300 | $447,100 |
| 2017 | $10,313 | $713,700 | $265,400 | $448,300 |
| 2016 | $9,618 | $657,400 | $252,900 | $404,500 |
| 2015 | $9,253 | $643,900 | $252,900 | $391,000 |
| 2014 | $8,676 | $609,300 | $241,200 | $368,100 |
Source: Public Records
Map
Nearby Homes
- 6 Patricia Cir
- 220 Burlington Ave
- 224 Burlington Ave
- 3 Clark Terrace
- 7 Cross St Unit 301
- 7 Cross St Unit 303
- 7 Cross St Unit 205
- 7 Cross St Unit 306
- 7 Cross St Unit 102
- 25 Mill Rd
- 3 Molloy Rd
- 48 Brand Ave
- 57 Taplin Ave
- 5 Cook Rd
- 14 Sarah St
- 46 Cottage St
- 56 Grove Ave
- 29 Beaverbrook Rd
- 197 Wildwood St
- 23 Rocky Hill Rd
- 3 Castle Dr
- 127 Burlington Ave
- 5 Castle Dr
- 133 Burlington Ave
- 2 Castle Dr
- 7 Castle Dr
- 149 Burlington Ave
- 134 Burlington Ave
- 138 Burlington Ave
- 4 Castle Dr
- 9 Castle Dr
- 153 Burlington Ave
- 109 Burlington Ave
- 2 Roberts Rd
- 2 Roberts Rd Unit A
- 11 Castle Dr
- 116 Burlington Ave
- 148 Burlington Ave
- 6 Castle Dr
- 1 Roberts Rd
Your Personal Tour Guide
Ask me questions while you tour the home.