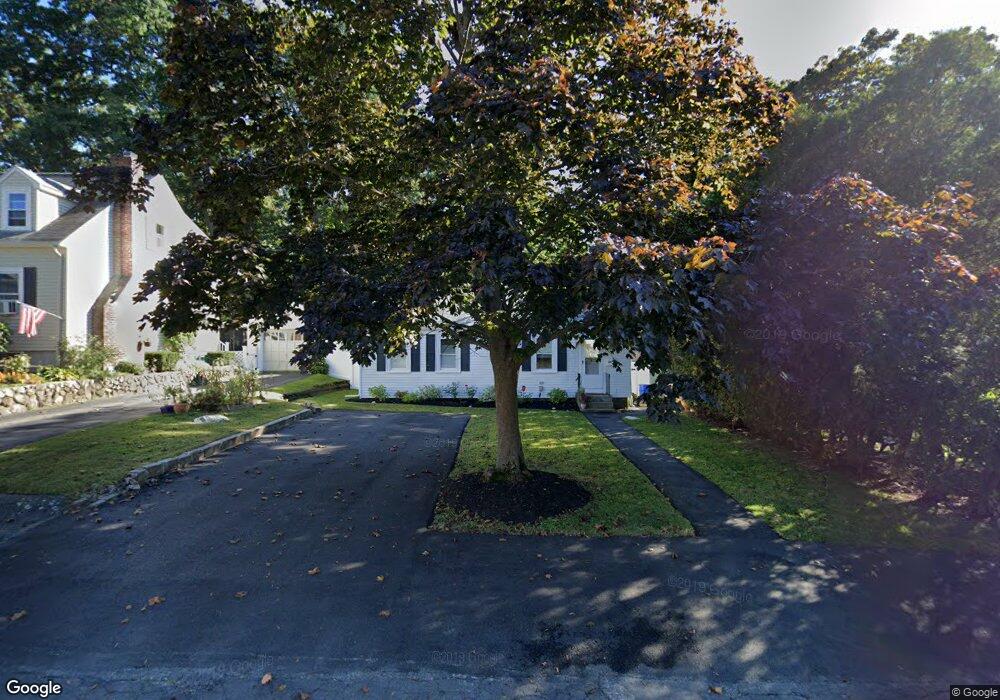
1 Catalpa St Unit A Wakefield, MA 01880
Montrose NeighborhoodEstimated Value: $605,000 - $642,000
2
Beds
1
Bath
884
Sq Ft
$704/Sq Ft
Est. Value
About This Home
This home is located at 1 Catalpa St Unit A, Wakefield, MA 01880 and is currently estimated at $621,972, approximately $703 per square foot. 1 Catalpa St Unit A is a home located in Middlesex County with nearby schools including Wakefield Memorial High School, St Joseph School, and Odyssey Day School.
Ownership History
Date
Name
Owned For
Owner Type
Purchase Details
Closed on
Aug 29, 2006
Sold by
Custodio Cacilio and Curley Mark M
Bought by
Emmons Edward R and Lembo Mary
Current Estimated Value
Home Financials for this Owner
Home Financials are based on the most recent Mortgage that was taken out on this home.
Original Mortgage
$270,750
Outstanding Balance
$164,008
Interest Rate
6.83%
Mortgage Type
Purchase Money Mortgage
Estimated Equity
$457,964
Create a Home Valuation Report for This Property
The Home Valuation Report is an in-depth analysis detailing your home's value as well as a comparison with similar homes in the area
Home Values in the Area
Average Home Value in this Area
Purchase History
| Date | Buyer | Sale Price | Title Company |
|---|---|---|---|
| Emmons Edward R | $285,000 | -- |
Source: Public Records
Mortgage History
| Date | Status | Borrower | Loan Amount |
|---|---|---|---|
| Open | Emmons Edward R | $270,750 |
Source: Public Records
Tax History Compared to Growth
Tax History
| Year | Tax Paid | Tax Assessment Tax Assessment Total Assessment is a certain percentage of the fair market value that is determined by local assessors to be the total taxable value of land and additions on the property. | Land | Improvement |
|---|---|---|---|---|
| 2025 | $6,606 | $582,000 | $357,600 | $224,400 |
| 2024 | $6,090 | $541,300 | $332,600 | $208,700 |
| 2023 | $5,928 | $505,400 | $310,500 | $194,900 |
| 2022 | $5,559 | $451,200 | $277,200 | $174,000 |
| 2021 | $5,250 | $412,400 | $253,400 | $159,000 |
| 2020 | $4,938 | $386,700 | $237,600 | $149,100 |
| 2019 | $4,294 | $334,700 | $221,800 | $112,900 |
| 2018 | $4,141 | $319,800 | $211,900 | $107,900 |
| 2017 | $3,895 | $298,900 | $198,000 | $100,900 |
| 2016 | $3,940 | $292,100 | $195,500 | $96,600 |
| 2015 | $3,680 | $273,000 | $182,700 | $90,300 |
| 2014 | $3,403 | $266,300 | $178,200 | $88,100 |
Source: Public Records
Map
Nearby Homes
- 11 Wilson Ave
- 6 Blue Jay Cir Unit 2
- 314 Water St Unit 5
- 13 Highland St
- 16 Pleasant St
- 1 Millbrook Ln Unit 304
- 9 Nelson Ave
- 24 Park St
- 5 Bateman Ct Unit 5
- 51 Crescent St
- 22 Wayland Rd
- 22 Jefferson Rd
- 35 Richardson St Unit 2
- 11 Muriel Ave
- 38 Bennett St Unit 3D
- 3 Garden Ln
- 199 Nahant St
- 134 Nahant St Unit B
- 9 Avon St Unit 2
- 48 Cordis St