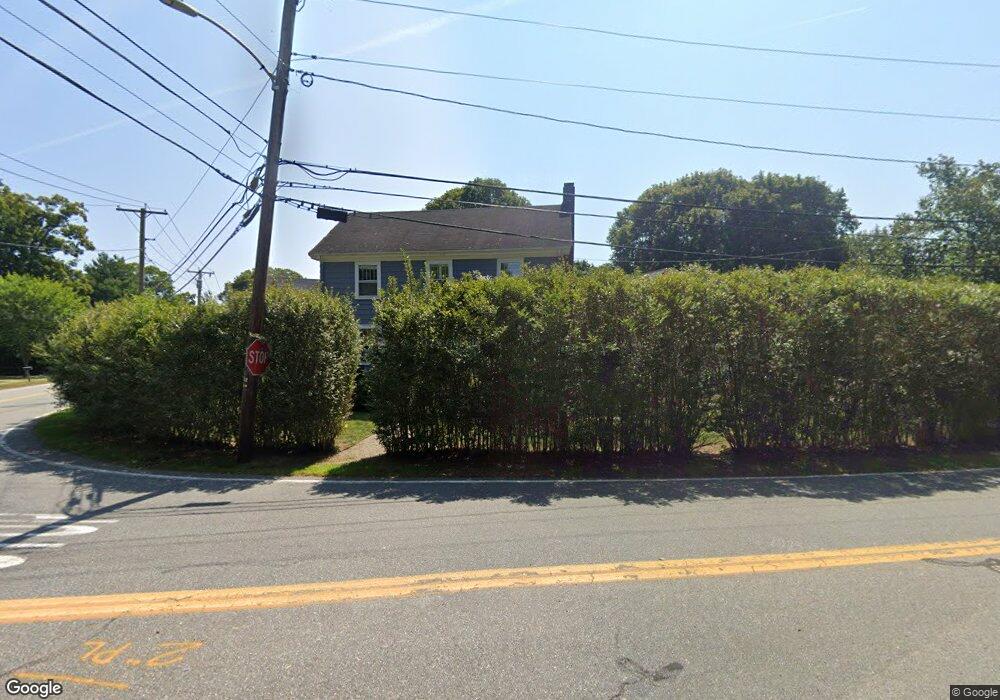
1 Cedar St Wenham, MA 01984
Estimated Value: $769,561 - $1,305,000
3
Beds
2
Baths
2,016
Sq Ft
$488/Sq Ft
Est. Value
About This Home
This home is located at 1 Cedar St, Wenham, MA 01984 and is currently estimated at $984,390, approximately $488 per square foot. 1 Cedar St is a home located in Essex County with nearby schools including Winthrop School, Bessie Buker Elementary School, and Cutler Elementary School.
Ownership History
Date
Name
Owned For
Owner Type
Purchase Details
Closed on
Sep 28, 2015
Sold by
Sharp Andrew and Sharp E A
Bought by
Barker Anne and Barker Oliver N
Current Estimated Value
Home Financials for this Owner
Home Financials are based on the most recent Mortgage that was taken out on this home.
Original Mortgage
$385,400
Outstanding Balance
$298,305
Interest Rate
3.97%
Mortgage Type
New Conventional
Estimated Equity
$686,085
Purchase Details
Closed on
Jan 28, 2011
Sold by
Sharp Andrew and Sharp Elizabeth
Bought by
Sharp Andrew and Sharp Elizabeth
Home Financials for this Owner
Home Financials are based on the most recent Mortgage that was taken out on this home.
Original Mortgage
$409,050
Interest Rate
4.83%
Mortgage Type
Purchase Money Mortgage
Purchase Details
Closed on
Oct 23, 2009
Sold by
Crimmins 3Rd Arthur L and Crimmins Amelia Cushing
Bought by
Sharp Andrew
Purchase Details
Closed on
Jul 31, 2007
Sold by
Day Sara
Bought by
Crimmins 3Rd Arthur L
Purchase Details
Closed on
Mar 15, 1996
Sold by
Sullivan Dorothy Est and Scott
Bought by
Day Sara
Create a Home Valuation Report for This Property
The Home Valuation Report is an in-depth analysis detailing your home's value as well as a comparison with similar homes in the area
Home Values in the Area
Average Home Value in this Area
Purchase History
| Date | Buyer | Sale Price | Title Company |
|---|---|---|---|
| Barker Anne | $483,000 | -- | |
| Sharp Andrew | -- | -- | |
| Sharp Andrew | -- | -- | |
| Sharp Andrew | $422,000 | -- | |
| Sharp Andrew | $422,000 | -- | |
| Crimmins 3Rd Arthur L | $445,000 | -- | |
| Crimmins 3Rd Arthur L | $445,000 | -- | |
| Day Sara | $225,000 | -- | |
| Day Sara | $225,000 | -- |
Source: Public Records
Mortgage History
| Date | Status | Borrower | Loan Amount |
|---|---|---|---|
| Open | Barker Anne | $385,400 | |
| Closed | Day Sara | $385,400 | |
| Previous Owner | Day Sara | $409,050 |
Source: Public Records
Tax History
| Year | Tax Paid | Tax Assessment Tax Assessment Total Assessment is a certain percentage of the fair market value that is determined by local assessors to be the total taxable value of land and additions on the property. | Land | Improvement |
|---|---|---|---|---|
| 2025 | $11,023 | $709,300 | $355,200 | $354,100 |
| 2024 | $10,837 | $692,000 | $355,200 | $336,800 |
| 2023 | $9,610 | $553,900 | $308,900 | $245,000 |
| 2022 | $9,890 | $505,100 | $248,700 | $256,400 |
| 2021 | $9,612 | $488,400 | $232,000 | $256,400 |
| 2020 | $8,972 | $473,700 | $225,000 | $248,700 |
| 2019 | $8,536 | $473,700 | $225,000 | $248,700 |
| 2018 | $8,238 | $438,400 | $217,700 | $220,700 |
| 2017 | $8,036 | $438,400 | $217,700 | $220,700 |
| 2016 | $6,030 | $355,100 | $217,700 | $137,400 |
| 2015 | $5,718 | $351,900 | $217,700 | $134,200 |
Source: Public Records
Map
Nearby Homes
Your Personal Tour Guide
Ask me questions while you tour the home.