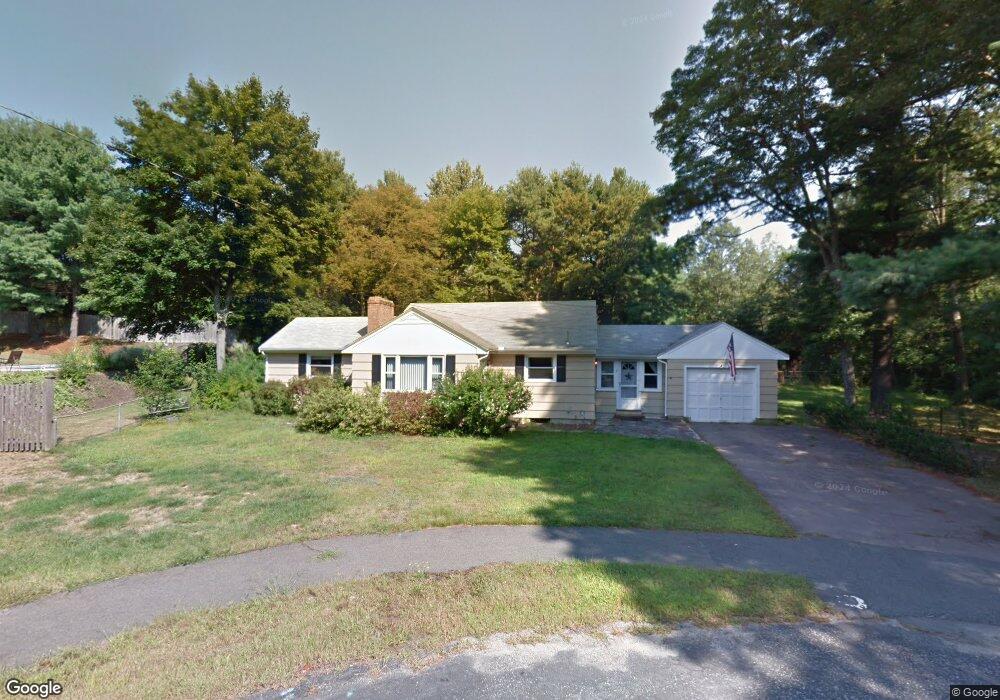
1 Chandler Ave Walpole, MA 02081
Estimated Value: $576,000 - $665,478
3
Beds
2
Baths
1,782
Sq Ft
$353/Sq Ft
Est. Value
About This Home
This home is located at 1 Chandler Ave, Walpole, MA 02081 and is currently estimated at $629,620, approximately $353 per square foot. 1 Chandler Ave is a home located in Norfolk County with nearby schools including Elm Street School, Eleanor N. Johnson Middle School, and Walpole High School.
Ownership History
Date
Name
Owned For
Owner Type
Purchase Details
Closed on
Nov 4, 2010
Sold by
Zaki Tony V
Bought by
Cook John J
Current Estimated Value
Home Financials for this Owner
Home Financials are based on the most recent Mortgage that was taken out on this home.
Original Mortgage
$140,000
Outstanding Balance
$92,667
Interest Rate
4.41%
Mortgage Type
Purchase Money Mortgage
Estimated Equity
$536,953
Purchase Details
Closed on
Jun 21, 2002
Sold by
Abrams Monty D and Abrams Olga
Bought by
Zaki Tony
Create a Home Valuation Report for This Property
The Home Valuation Report is an in-depth analysis detailing your home's value as well as a comparison with similar homes in the area
Home Values in the Area
Average Home Value in this Area
Purchase History
| Date | Buyer | Sale Price | Title Company |
|---|---|---|---|
| Cook John J | $315,000 | -- | |
| Zaki Tony | $288,000 | -- |
Source: Public Records
Mortgage History
| Date | Status | Borrower | Loan Amount |
|---|---|---|---|
| Open | Cook John J | $140,000 |
Source: Public Records
Tax History
| Year | Tax Paid | Tax Assessment Tax Assessment Total Assessment is a certain percentage of the fair market value that is determined by local assessors to be the total taxable value of land and additions on the property. | Land | Improvement |
|---|---|---|---|---|
| 2025 | $6,596 | $514,100 | $299,600 | $214,500 |
| 2024 | $6,384 | $482,900 | $288,000 | $194,900 |
| 2023 | $6,173 | $444,400 | $250,400 | $194,000 |
| 2022 | $5,861 | $405,300 | $231,900 | $173,400 |
| 2021 | $5,672 | $382,200 | $218,800 | $163,400 |
| 2020 | $5,633 | $375,800 | $206,400 | $169,400 |
| 2019 | $5,644 | $373,800 | $198,300 | $175,500 |
| 2018 | $5,186 | $339,600 | $191,000 | $148,600 |
| 2017 | $5,031 | $328,200 | $183,600 | $144,600 |
| 2016 | $4,989 | $320,600 | $178,300 | $142,300 |
| 2015 | $4,859 | $309,500 | $169,800 | $139,700 |
| 2014 | $4,652 | $295,200 | $169,800 | $125,400 |
Source: Public Records
Map
Nearby Homes
- 10 Weathervane Dr Unit 20
- 3 Weathervane Dr Unit 1
- 8 Weathervane Dr Unit 19
- 25 Sandtrap Cir Unit 8
- 2 Breezewood Ln
- 195 Lincoln Rd
- 12 Weathervane Dr Unit 21
- 31 Pintail Rd
- 124 Clear Pond Dr
- 26 Kittredge St
- 24 Marion St
- 6 Teal Cir
- 1391 Main St Unit 305
- 1391 Main St Unit 301
- 2 Sterling Ln Unit 2
- 12 Brookside Ln
- 37 Thomas Mann Cir Unit 23
- 47 Thomas Mann Cir Unit 28
- 57 Thomas Mann Cir Unit Lot 33
- 189 1/2 Seekonk St
Your Personal Tour Guide
Ask me questions while you tour the home.