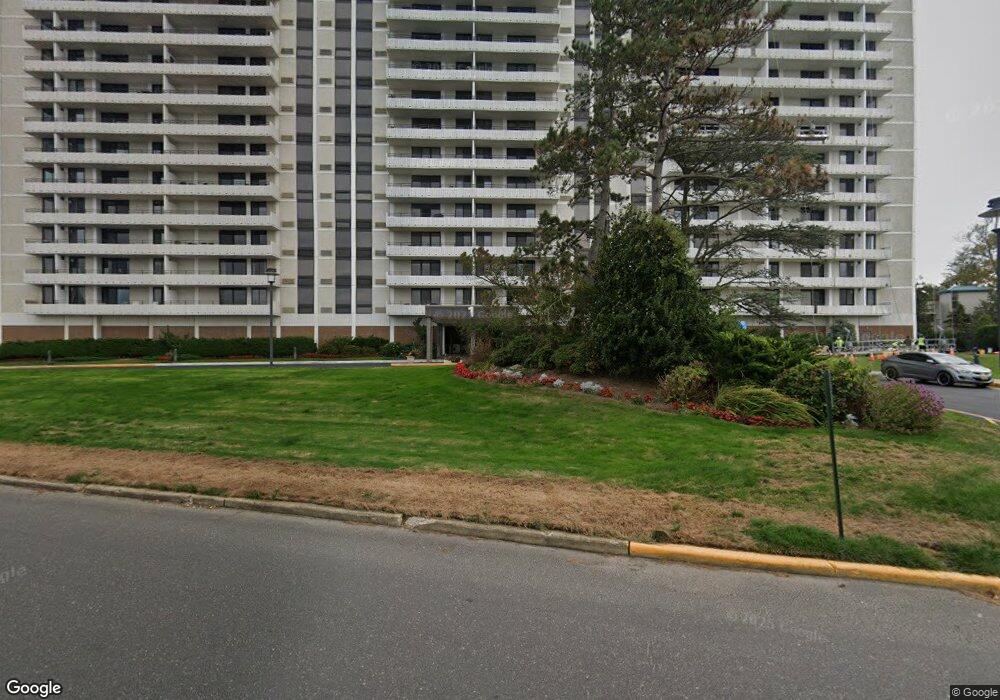
Channel Club Tower 1 Channel Dr Monmouth Beach, NJ 07750
Estimated Value: $560,258 - $689,000
1
Bed
2
Baths
992
Sq Ft
$643/Sq Ft
Est. Value
About This Home
This home is located at 1 Channel Dr, Monmouth Beach, NJ 07750 and is currently estimated at $638,315, approximately $643 per square foot. 1 Channel Dr is a home located in Monmouth County with nearby schools including Monmouth Beach School District, Shore Regional High School, and Holy Cross School.
Ownership History
Date
Name
Owned For
Owner Type
Purchase Details
Closed on
Jan 24, 2019
Sold by
Rosina Oksana and Herskovits Zena
Bought by
Herskovits Zena
Current Estimated Value
Purchase Details
Closed on
Feb 8, 2010
Sold by
Brown Linda
Bought by
Rosina Oksana and Herskovits Zena
Home Financials for this Owner
Home Financials are based on the most recent Mortgage that was taken out on this home.
Original Mortgage
$150,000
Interest Rate
4.47%
Mortgage Type
New Conventional
Purchase Details
Closed on
Jun 22, 2001
Sold by
Ovanesian Haiguni
Bought by
Weintraub David
Home Financials for this Owner
Home Financials are based on the most recent Mortgage that was taken out on this home.
Original Mortgage
$161,500
Interest Rate
7.14%
Create a Home Valuation Report for This Property
The Home Valuation Report is an in-depth analysis detailing your home's value as well as a comparison with similar homes in the area
Home Values in the Area
Average Home Value in this Area
Purchase History
| Date | Buyer | Sale Price | Title Company |
|---|---|---|---|
| Herskovits Zena | -- | Ridge Abstract Corp | |
| Rosina Oksana | $310,000 | None Available | |
| Weintraub David | $170,000 | -- |
Source: Public Records
Mortgage History
| Date | Status | Borrower | Loan Amount |
|---|---|---|---|
| Closed | Rosina Oksana | $150,000 | |
| Previous Owner | Weintraub David | $161,500 |
Source: Public Records
Tax History Compared to Growth
Tax History
| Year | Tax Paid | Tax Assessment Tax Assessment Total Assessment is a certain percentage of the fair market value that is determined by local assessors to be the total taxable value of land and additions on the property. | Land | Improvement |
|---|---|---|---|---|
| 2025 | $4,902 | $535,500 | $300,200 | $235,300 |
| 2024 | $4,902 | $473,400 | $234,000 | $239,400 |
| 2023 | $4,902 | $475,900 | $270,000 | $205,900 |
| 2022 | $3,820 | $422,300 | $224,300 | $198,000 |
| 2021 | $3,820 | $383,400 | $189,800 | $193,600 |
| 2020 | $4,195 | $342,200 | $112,900 | $229,300 |
| 2019 | $3,994 | $332,300 | $109,700 | $222,600 |
| 2018 | $3,901 | $317,400 | $104,700 | $212,700 |
| 2017 | $3,963 | $312,500 | $103,100 | $209,400 |
| 2016 | $3,478 | $262,900 | $86,800 | $176,100 |
| 2015 | $3,117 | $248,000 | $81,800 | $166,200 |
| 2014 | $3,047 | $234,400 | $103,100 | $131,300 |
Source: Public Records
About Channel Club Tower
Map
Nearby Homes
- 1 Channel Dr Unit 705
- 1 Channel Dr Unit 709
- 1 Channel Dr Unit 1708
- 1 Channel Dr Unit 214
- 1 Channel Dr Unit 1705
- 149 Wharfside Dr Unit 705
- 173 Wharfside Dr Unit 805
- 79 Riverdale Ave
- 44 Monmouth Pkwy
- 75 Wharfside Dr
- 92 Wharfside Dr
- 9 Woolley St
- 2 Wharfside Dr Unit 2
- 55 Ocean Ave Unit 3L
- 55 Ocean Ave Unit 3H
- 26 Wesley St
- 31 Wesley St
- 25 Spaulding Place
- 100 Seaview Ave Unit 3B
- 25 Meadow Ave Unit 30
- 1 Channel Dr Unit 1608
- 1 Channel Dr Unit 1412/1413
- 1 Channel Dr Unit 701A
- 1 Channel Dr
- 1 Channel Dr
- 1 Channel Dr
- 1 Channel Dr
- 1 Channel Dr
- 1 Channel Dr Unit 1802
- 1 Channel Dr
- 1 Channel Dr
- 1 Channel Dr
- 1 Channel Dr
- 1 Channel Dr
- 1 Channel Dr
- 1 Channel Dr
- 1 Channel Dr
- 1 Channel Dr
- 1 Channel Dr
- 1 Channel Dr