1 Charles Place East Bridgewater, MA 02333
Estimated Value: $530,000 - $671,000
3
Beds
2
Baths
1,008
Sq Ft
$577/Sq Ft
Est. Value
About This Home
This home is located at 1 Charles Place, East Bridgewater, MA 02333 and is currently estimated at $581,497, approximately $576 per square foot. 1 Charles Place is a home located in Plymouth County with nearby schools including Central Elementary School, Gordon W Mitchell Middle School, and East Bridgewater Jr./Sr. High School.
Ownership History
Date
Name
Owned For
Owner Type
Purchase Details
Closed on
Dec 4, 2002
Sold by
Young Todd M and Young Nicole F
Bought by
Connors Shawn P and Connors Joanne
Current Estimated Value
Home Financials for this Owner
Home Financials are based on the most recent Mortgage that was taken out on this home.
Original Mortgage
$223,900
Interest Rate
6.34%
Mortgage Type
Purchase Money Mortgage
Purchase Details
Closed on
Nov 2, 1994
Sold by
Mi-Car Rt and Lopez James G
Bought by
Young Todd and Dooley Nicole
Create a Home Valuation Report for This Property
The Home Valuation Report is an in-depth analysis detailing your home's value as well as a comparison with similar homes in the area
Home Values in the Area
Average Home Value in this Area
Purchase History
| Date | Buyer | Sale Price | Title Company |
|---|---|---|---|
| Connors Shawn P | $279,900 | -- | |
| Young Todd | $129,900 | -- |
Source: Public Records
Mortgage History
| Date | Status | Borrower | Loan Amount |
|---|---|---|---|
| Open | Young Todd | $253,005 | |
| Closed | Young Todd | $262,800 | |
| Closed | Young Todd | $223,900 |
Source: Public Records
Tax History Compared to Growth
Tax History
| Year | Tax Paid | Tax Assessment Tax Assessment Total Assessment is a certain percentage of the fair market value that is determined by local assessors to be the total taxable value of land and additions on the property. | Land | Improvement |
|---|---|---|---|---|
| 2025 | $5,981 | $437,500 | $196,600 | $240,900 |
| 2024 | $5,865 | $423,800 | $189,000 | $234,800 |
| 2023 | $5,789 | $400,600 | $189,000 | $211,600 |
| 2022 | $5,694 | $365,000 | $171,900 | $193,100 |
| 2021 | $5,553 | $325,700 | $165,200 | $160,500 |
| 2020 | $5,334 | $308,500 | $159,200 | $149,300 |
| 2019 | $5,173 | $294,600 | $152,100 | $142,500 |
| 2018 | $4,919 | $273,900 | $152,100 | $121,800 |
| 2017 | $4,780 | $261,200 | $145,100 | $116,100 |
| 2016 | $4,662 | $256,700 | $145,100 | $111,600 |
| 2015 | $4,534 | $255,300 | $144,100 | $111,200 |
| 2014 | $4,355 | $250,700 | $141,100 | $109,600 |
Source: Public Records
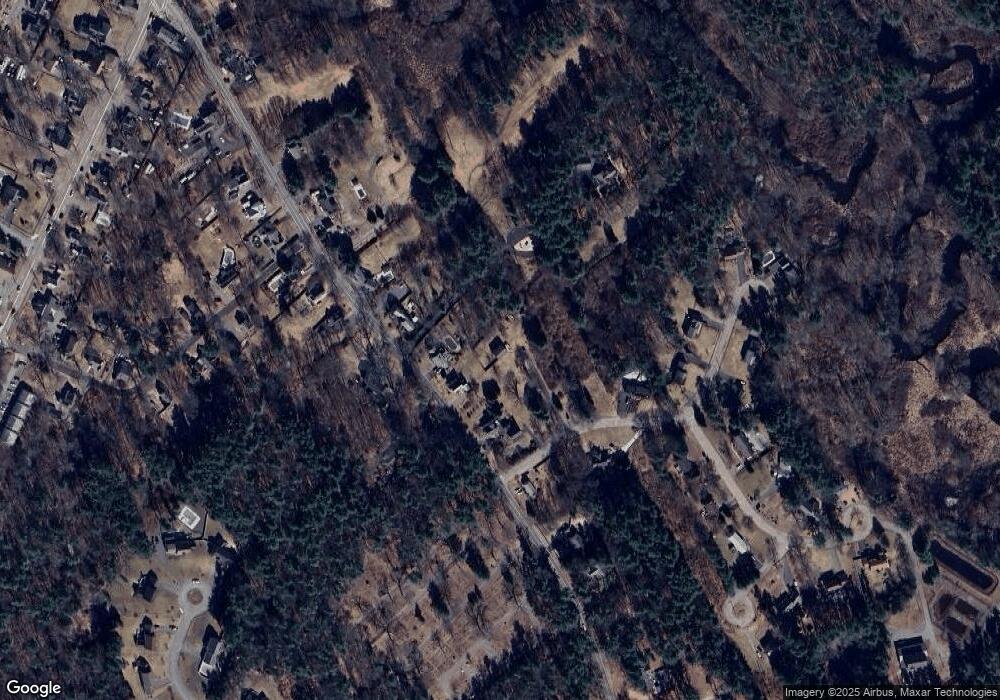
Map
Nearby Homes