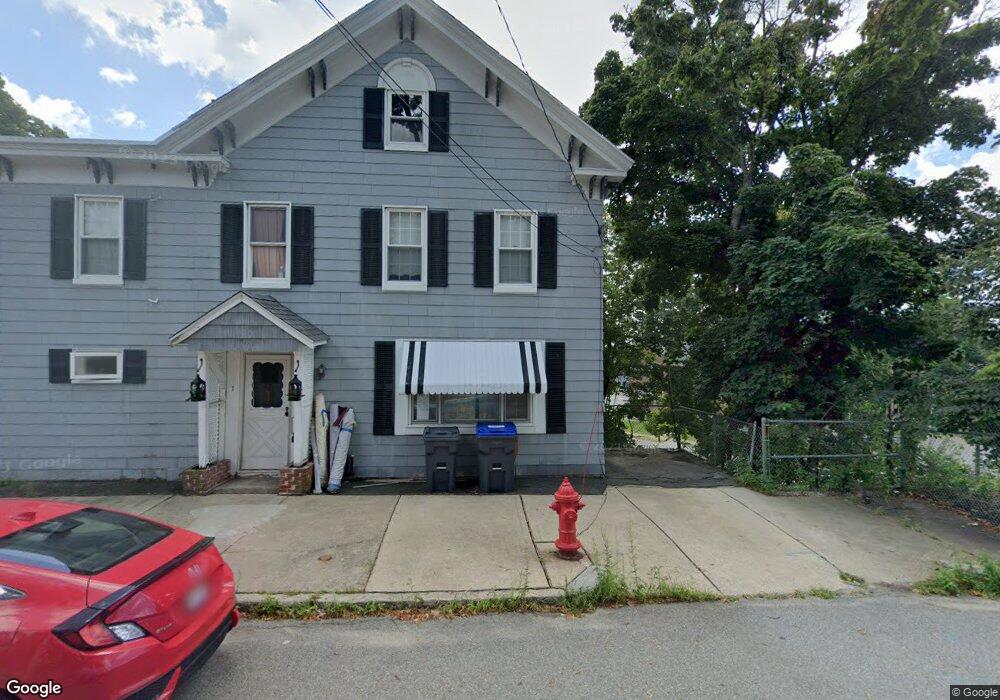
1 Charles St Methuen, MA 01844
Downtown Methuen NeighborhoodEstimated Value: $547,000 - $594,000
4
Beds
2
Baths
2,116
Sq Ft
$266/Sq Ft
Est. Value
About This Home
This home is located at 1 Charles St, Methuen, MA 01844 and is currently estimated at $562,507, approximately $265 per square foot. 1 Charles St is a home located in Essex County with nearby schools including Tenney Grammar School, Methuen High School, and Saint Monica School.
Ownership History
Date
Name
Owned For
Owner Type
Purchase Details
Closed on
Feb 28, 2022
Sold by
Dube Ernest A and Dube Edward E
Bought by
Dube John A and Dube Phyllis M
Current Estimated Value
Home Financials for this Owner
Home Financials are based on the most recent Mortgage that was taken out on this home.
Original Mortgage
$315,425
Outstanding Balance
$292,840
Interest Rate
3.69%
Mortgage Type
FHA
Estimated Equity
$269,667
Create a Home Valuation Report for This Property
The Home Valuation Report is an in-depth analysis detailing your home's value as well as a comparison with similar homes in the area
Home Values in the Area
Average Home Value in this Area
Purchase History
| Date | Buyer | Sale Price | Title Company |
|---|---|---|---|
| Dube John A | $296,625 | None Available |
Source: Public Records
Mortgage History
| Date | Status | Borrower | Loan Amount |
|---|---|---|---|
| Open | Dube John A | $315,425 | |
| Closed | Dube John A | $315,425 |
Source: Public Records
Tax History Compared to Growth
Tax History
| Year | Tax Paid | Tax Assessment Tax Assessment Total Assessment is a certain percentage of the fair market value that is determined by local assessors to be the total taxable value of land and additions on the property. | Land | Improvement |
|---|---|---|---|---|
| 2025 | $4,305 | $406,900 | $179,200 | $227,700 |
| 2024 | $4,185 | $385,400 | $163,400 | $222,000 |
| 2023 | $4,025 | $344,000 | $145,300 | $198,700 |
| 2022 | $3,799 | $291,100 | $121,100 | $170,000 |
| 2021 | $3,577 | $271,200 | $115,000 | $156,200 |
| 2020 | $3,552 | $264,300 | $115,000 | $149,300 |
| 2019 | $3,359 | $236,700 | $102,900 | $133,800 |
| 2018 | $3,284 | $230,100 | $102,900 | $127,200 |
| 2017 | $3,202 | $218,600 | $102,900 | $115,700 |
| 2016 | $3,104 | $209,600 | $96,800 | $112,800 |
| 2015 | $2,993 | $205,000 | $96,800 | $108,200 |
Source: Public Records
Map
Nearby Homes
- 35 Hardy St
- 24 Railroad St
- 100-102 Phillips St
- 83 Arnold St
- 20-22 Ashland Ave
- 18 Larchwood Rd
- 69 Broadway
- 23 Chase St
- 29 Center St
- 82 Oakside Ave
- 87 Oakside Ave
- 83 Oakside Ave
- 2 Lawrence St
- 364 Lawrence St
- 190-192 Oakland Ave
- 5 Arlington Terrace
- 37 Maplewood Ave
- 4 Capitol St
- 434-438 Hampshire St
- 183 Berkeley St
- 3 Charles St
- 15 Pleasant St
- 257 Lawrence St
- 13 Pleasant St
- 13 Pleasant St Unit 2
- 9 Charles St
- 9 Pleasant St
- 15 Charles St
- 11 Charles St
- 36 Park St
- 30 Park St
- 270 Lawrence St Unit 1
- 270 Lawrence St Unit 1C
- 270 Lawrence St Unit 1B
- 270 Lawrence St Unit 1A
- 270 Lawrence St
- 20 Pleasant St
- 2 Osgood St
- 18 Pleasant St Unit 20
- 17 Charles St