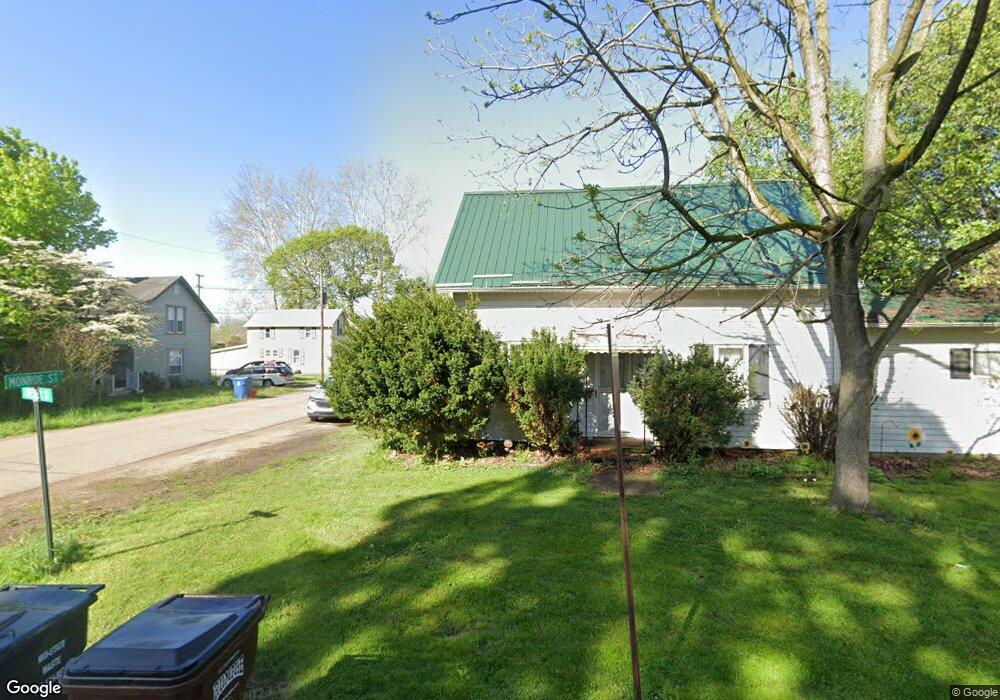
1 Chester St Mount Vernon, OH 43050
Estimated Value: $176,000 - $243,000
3
Beds
2
Baths
1,892
Sq Ft
$105/Sq Ft
Est. Value
About This Home
This home is located at 1 Chester St, Mount Vernon, OH 43050 and is currently estimated at $199,581, approximately $105 per square foot. 1 Chester St is a home located in Knox County with nearby schools including Mount Vernon High School, St. Vincent de Paul School, and Christian Star Academy.
Ownership History
Date
Name
Owned For
Owner Type
Purchase Details
Closed on
Dec 7, 2010
Sold by
Fannie Mae
Bought by
Thomas Noah
Current Estimated Value
Purchase Details
Closed on
Dec 4, 2009
Sold by
Woods Arthur L
Bought by
Countrywide Home Loans Inc
Purchase Details
Closed on
Jul 28, 2004
Sold by
Olk Brian F and Olk Sally J
Bought by
Woods Arthur L and Woods Annemari
Purchase Details
Closed on
Apr 3, 2000
Sold by
Stricker Daniel M and Stricker Patri
Bought by
Olk Brian F and Olk Sally J
Purchase Details
Closed on
Feb 25, 1999
Sold by
Stricker Daniel M
Bought by
Stricker Daniel M and Stricker Patri
Purchase Details
Closed on
Jul 22, 1994
Sold by
Banbury Michael
Bought by
Stricker Daniel M
Create a Home Valuation Report for This Property
The Home Valuation Report is an in-depth analysis detailing your home's value as well as a comparison with similar homes in the area
Home Values in the Area
Average Home Value in this Area
Purchase History
| Date | Buyer | Sale Price | Title Company |
|---|---|---|---|
| Thomas Noah | $21,675 | None Available | |
| Countrywide Home Loans Inc | $48,000 | None Available | |
| Woods Arthur L | $84,700 | -- | |
| Olk Brian F | $71,500 | -- | |
| Stricker Daniel M | -- | -- | |
| Stricker Daniel M | $55,500 | -- |
Source: Public Records
Tax History Compared to Growth
Tax History
| Year | Tax Paid | Tax Assessment Tax Assessment Total Assessment is a certain percentage of the fair market value that is determined by local assessors to be the total taxable value of land and additions on the property. | Land | Improvement |
|---|---|---|---|---|
| 2024 | $1,574 | $39,790 | $5,580 | $34,210 |
| 2023 | $1,574 | $39,790 | $5,580 | $34,210 |
| 2022 | $1,505 | $34,600 | $4,850 | $29,750 |
| 2021 | $1,505 | $34,600 | $4,850 | $29,750 |
| 2020 | $1,466 | $34,600 | $4,850 | $29,750 |
| 2019 | $1,427 | $31,410 | $6,290 | $25,120 |
| 2018 | $1,430 | $31,410 | $6,290 | $25,120 |
| 2017 | $1,406 | $31,410 | $6,290 | $25,120 |
| 2016 | $1,305 | $29,080 | $5,820 | $23,260 |
| 2015 | $1,311 | $29,080 | $5,820 | $23,260 |
| 2014 | $1,318 | $29,080 | $5,820 | $23,260 |
| 2013 | $1,670 | $35,130 | $5,470 | $29,660 |
Source: Public Records
Map
Nearby Homes