Estimated Value: $136,000 - $261,726
--
Bed
4
Baths
2,680
Sq Ft
$81/Sq Ft
Est. Value
About This Home
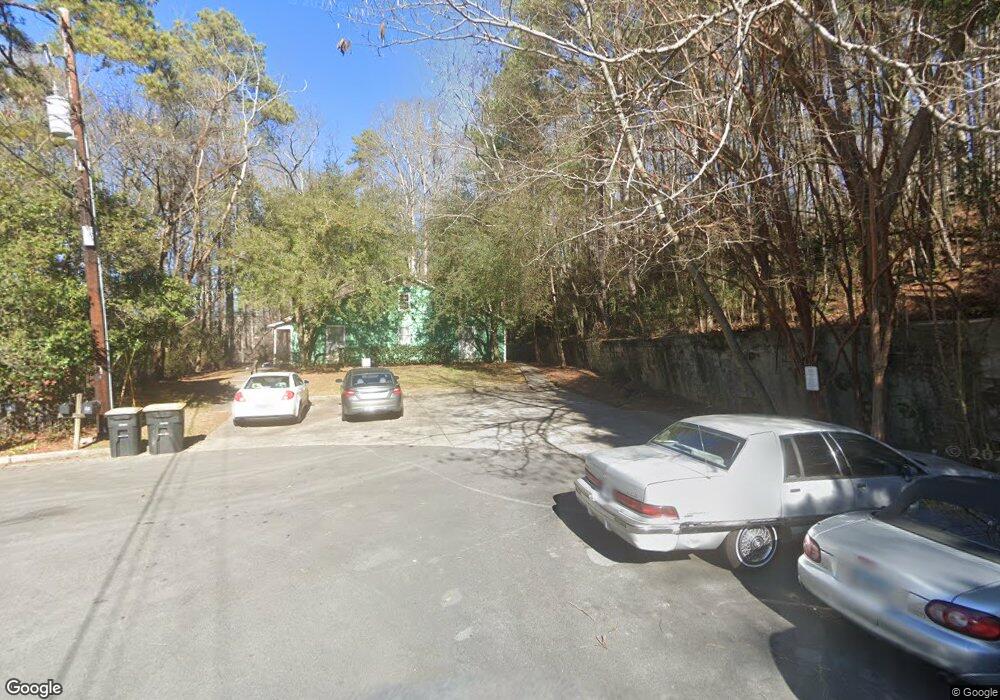
This home is located at 1 Cliffview Dr SE, Rome, GA 30161 and is currently estimated at $217,932, approximately $81 per square foot. 1 Cliffview Dr SE is a home with nearby schools including Rome High School, Montessori School of Rome, and St. Mary School.
Ownership History
Date
Name
Owned For
Owner Type
Purchase Details
Closed on
Dec 9, 2014
Sold by
Williams Gardner
Bought by
Gardner Williams Properties Llc
Current Estimated Value
Purchase Details
Closed on
May 10, 2004
Sold by
Rana Sajida
Bought by
Williams Gardner
Purchase Details
Closed on
May 7, 2003
Sold by
Smith Dorothy W and Gardner Williams
Bought by
Rana Sajida
Purchase Details
Closed on
Feb 25, 2003
Bought by
P and R
Purchase Details
Closed on
Feb 21, 2003
Sold by
Smith Randall and Gardner Williams
Bought by
Smith Dorothy W and Gardner Williams
Purchase Details
Closed on
Apr 14, 1999
Sold by
Williams Charles S
Bought by
Smith Randall and Gardner Williams
Purchase Details
Closed on
Sep 24, 1991
Sold by
Three Rivers Company Inc
Bought by
Williams Charles S
Purchase Details
Closed on
Oct 17, 1985
Sold by
Century Properties Inc
Bought by
Three Rivers Company Inc
Purchase Details
Closed on
Dec 31, 1974
Bought by
Century Properties Inc
Create a Home Valuation Report for This Property
The Home Valuation Report is an in-depth analysis detailing your home's value as well as a comparison with similar homes in the area
Home Values in the Area
Average Home Value in this Area
Purchase History
| Date | Buyer | Sale Price | Title Company |
|---|---|---|---|
| Gardner Williams Properties Llc | -- | -- | |
| Williams Gardner | -- | -- | |
| Rana Sajida | $146,000 | -- | |
| P | -- | -- | |
| Smith Dorothy W | -- | -- | |
| Smith Randall | $73,700 | -- | |
| Williams Charles S | -- | -- | |
| Three Rivers Company Inc | $8,000 | -- | |
| Century Properties Inc | -- | -- |
Source: Public Records
Tax History Compared to Growth
Tax History
| Year | Tax Paid | Tax Assessment Tax Assessment Total Assessment is a certain percentage of the fair market value that is determined by local assessors to be the total taxable value of land and additions on the property. | Land | Improvement |
|---|---|---|---|---|
| 2024 | $3,200 | $83,496 | $5,040 | $78,456 |
| 2023 | $2,957 | $81,166 | $5,040 | $76,126 |
| 2022 | $2,465 | $67,550 | $4,800 | $62,750 |
| 2021 | $2,088 | $56,280 | $4,800 | $51,480 |
| 2020 | $2,011 | $53,741 | $4,800 | $48,941 |
| 2019 | $1,893 | $51,131 | $4,800 | $46,331 |
| 2018 | $1,701 | $45,950 | $4,800 | $41,150 |
| 2017 | $1,653 | $44,650 | $4,800 | $39,850 |
| 2016 | $1,402 | $37,760 | $4,800 | $32,960 |
| 2015 | $1,615 | $38,200 | $4,800 | $33,400 |
| 2014 | $1,615 | $38,200 | $4,800 | $33,400 |
Source: Public Records
Map
Nearby Homes
- 211 Chateau Dr SE
- 22 Coventry Dr SE
- 20 Coventry Dr SE
- 35 Cumberland Dr SE
- 15 Saddlebrook Dr SE
- 36 Coventry Dr SE
- 38 Coventry Dr SE
- 3 Belmont Ct SE
- 18 Wellington Way SE
- 14 Wellington Way SE
- 2107 Rockmart Rd SE
- 119 Chateau Dr SE
- 113 Chateau Dr SE
- 0 Wellington Way SE Unit 7374604
- 0 Wellington Way SE Unit 7374602
- 0 Wellington Way SE Unit 20180069
- 0 Wellington Way SE Unit 20180068
- 519 Dr SE
- 211 Alfred Ave SE
- 2 Cliffview Dr SE Unit 6
- 2 Cliffview Dr SE Unit 5
- 2 Cliffview Dr SE Unit 2
- 24 Coventry Dr SE
- 4 Cliffview Dr SE
- 26 Coventry Dr SE
- 28 Coventry Dr SE
- 205 Chateau Dr SE
- 6 Cliffview Dr SE
- 207 Chateau Dr SE
- 3 Cumberland Dr SE
- 209 Chateau Dr SE
- 5 Cliffview Dr SE
- 7 Cliffview Dr SE
- 36 Cumberland Dr SE
- 8 Cliffview Dr SE
- 25 Coventry Dr SE
- 18 Coventry Dr SE
- 15 Coventry Dr SE
- 213 Chateau Dr SE