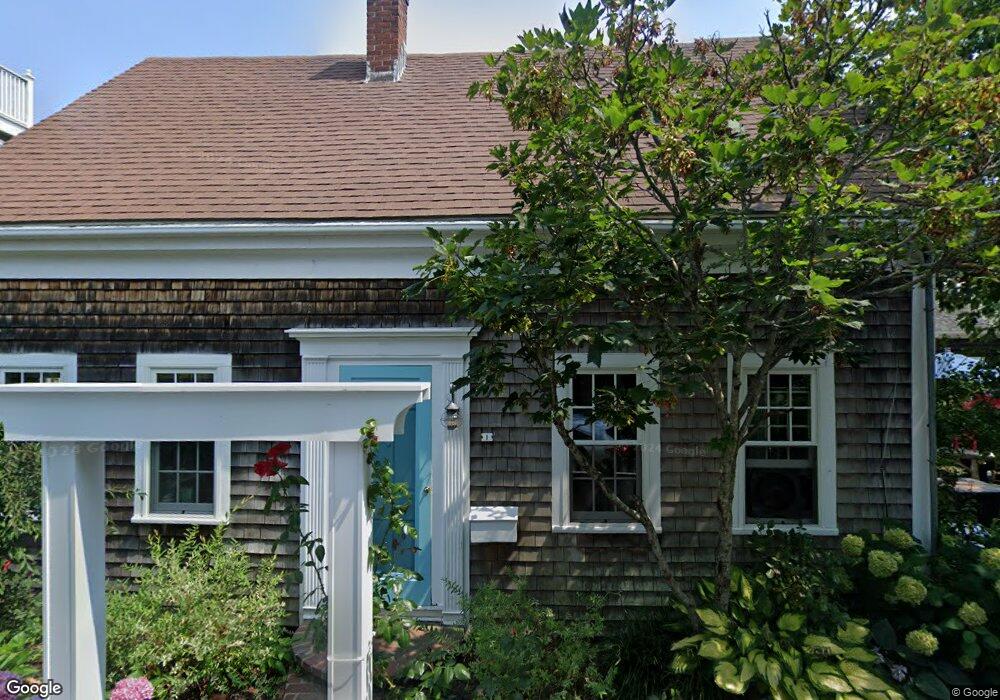
1 Conway St Provincetown, MA 02657
Estimated Value: $1,786,042 - $2,225,000
3
Beds
2
Baths
1,155
Sq Ft
$1,652/Sq Ft
Est. Value
About This Home
This home is located at 1 Conway St, Provincetown, MA 02657 and is currently estimated at $1,907,511, approximately $1,651 per square foot. 1 Conway St is a home located in Barnstable County with nearby schools including Provincetown Schools.
Ownership History
Date
Name
Owned For
Owner Type
Purchase Details
Closed on
Jul 27, 2004
Sold by
Brown Vernon L
Bought by
Hartness Lynn
Current Estimated Value
Purchase Details
Closed on
Apr 9, 2004
Sold by
Sioholm Alfred P
Bought by
Brown Vernon L
Home Financials for this Owner
Home Financials are based on the most recent Mortgage that was taken out on this home.
Original Mortgage
$513,600
Interest Rate
5.6%
Mortgage Type
Purchase Money Mortgage
Create a Home Valuation Report for This Property
The Home Valuation Report is an in-depth analysis detailing your home's value as well as a comparison with similar homes in the area
Home Values in the Area
Average Home Value in this Area
Purchase History
| Date | Buyer | Sale Price | Title Company |
|---|---|---|---|
| Hartness Lynn | $775,000 | -- | |
| Hartness Lynn | $775,000 | -- | |
| Brown Vernon L | $644,000 | -- | |
| Brown Vernon L | $644,000 | -- |
Source: Public Records
Mortgage History
| Date | Status | Borrower | Loan Amount |
|---|---|---|---|
| Previous Owner | Brown Vernon L | $513,600 |
Source: Public Records
Tax History Compared to Growth
Tax History
| Year | Tax Paid | Tax Assessment Tax Assessment Total Assessment is a certain percentage of the fair market value that is determined by local assessors to be the total taxable value of land and additions on the property. | Land | Improvement |
|---|---|---|---|---|
| 2025 | $8,105 | $1,447,300 | $700,900 | $746,400 |
| 2024 | $7,659 | $1,372,600 | $667,900 | $704,700 |
| 2023 | $6,823 | $1,141,000 | $580,900 | $560,100 |
| 2022 | $6,418 | $963,600 | $542,900 | $420,700 |
| 2021 | $6,060 | $855,900 | $493,500 | $362,400 |
| 2020 | $5,667 | $856,100 | $511,800 | $344,300 |
| 2019 | $5,776 | $818,200 | $496,900 | $321,300 |
| 2018 | $5,474 | $734,700 | $479,800 | $254,900 |
| 2017 | $5,400 | $700,400 | $470,300 | $230,100 |
| 2016 | $5,297 | $679,100 | $456,600 | $222,500 |
| 2015 | $3,955 | $535,900 | $319,700 | $216,200 |
Source: Public Records
Map
Nearby Homes
- 580 Commercial St
- 593 Commercial St
- 561 Commercial St
- 592 Commercial St
- 594 Commercial St
- 289 Bradford St
- 290A Bradford St
- 613 Commercial St
- 262 Bradford St Unit 2
- 539 Commercial St Unit 1
- 616 Commercial St Unit 10
- 616 Commercial St Unit 14
- 616 Commercial St Unit 15
- 616 Commercial St Unit 5
- 624 Commercial St
- 521 Commercial St Unit 2
- 633 Commercial St Unit 2
- 4 Conway St Unit 2
- 4 Conway St Unit 1
- 2-A Conway St
- 2 Conway St
- 572-572A Commercial St
- 1 Duncan Ln
- 277 Bradford St
- 3 Conway St
- 10 Snow St
- 10 Snow St
- 274 Bradford St
- 570 Commercial St
- 580-582 Commercial St
- 5 Snow St
- 572 Commercial St Unit 572A
- 269A Bradford St
- 269-A Bradford St
- 566 Commercial St Unit 5
- 566 Commercial St Unit 1