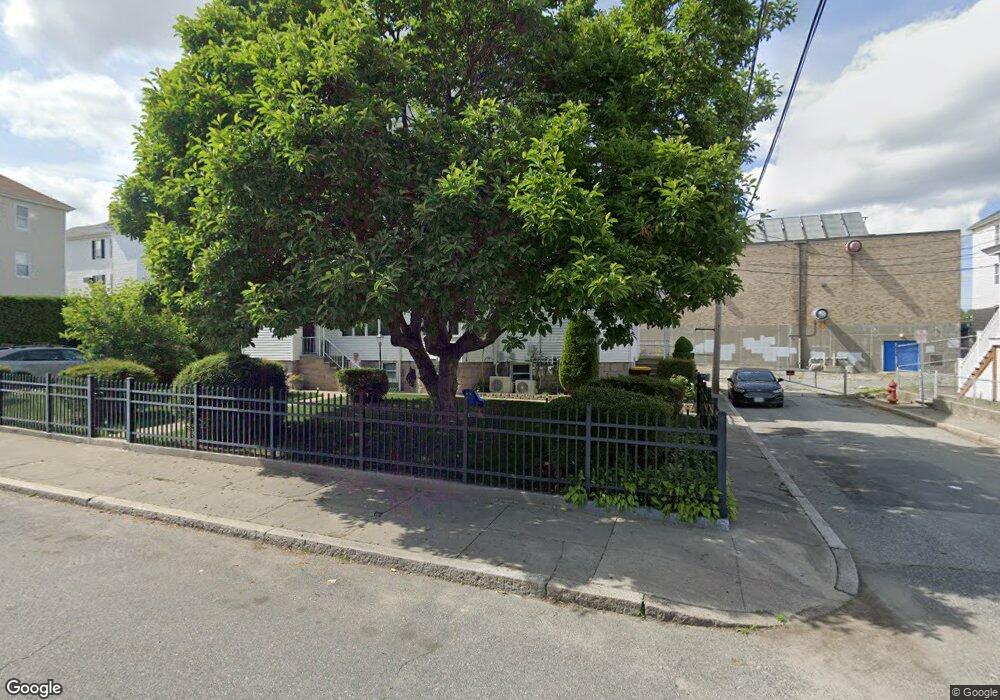
1 Cross St Fall River, MA 02723
Flint NeighborhoodEstimated Value: $625,000 - $781,000
9
Beds
4
Baths
4,809
Sq Ft
$143/Sq Ft
Est. Value
About This Home
This home is located at 1 Cross St, Fall River, MA 02723 and is currently estimated at $686,000, approximately $142 per square foot. 1 Cross St is a home located in Bristol County with nearby schools including Mary Fonseca Elementary School, Talbot Innovation School, and B M C Durfee High School.
Ownership History
Date
Name
Owned For
Owner Type
Purchase Details
Closed on
Dec 30, 2020
Sold by
Sousa Maria F and Sousa Felisberto
Bought by
Sousa Irt
Current Estimated Value
Purchase Details
Closed on
Mar 31, 1998
Sold by
Fagundo Gilda
Bought by
Sousa Felisberto M and Sousa Maria F
Home Financials for this Owner
Home Financials are based on the most recent Mortgage that was taken out on this home.
Original Mortgage
$100,000
Interest Rate
6.96%
Mortgage Type
Purchase Money Mortgage
Create a Home Valuation Report for This Property
The Home Valuation Report is an in-depth analysis detailing your home's value as well as a comparison with similar homes in the area
Home Values in the Area
Average Home Value in this Area
Purchase History
| Date | Buyer | Sale Price | Title Company |
|---|---|---|---|
| Sousa Irt | -- | None Available | |
| Sousa Felisberto M | $100,000 | -- |
Source: Public Records
Mortgage History
| Date | Status | Borrower | Loan Amount |
|---|---|---|---|
| Previous Owner | Sousa Felisberto M | $100,000 |
Source: Public Records
Tax History
| Year | Tax Paid | Tax Assessment Tax Assessment Total Assessment is a certain percentage of the fair market value that is determined by local assessors to be the total taxable value of land and additions on the property. | Land | Improvement |
|---|---|---|---|---|
| 2025 | $7,139 | $623,500 | $110,100 | $513,400 |
| 2024 | $6,815 | $593,100 | $106,100 | $487,000 |
| 2023 | $6,038 | $492,100 | $87,600 | $404,500 |
| 2022 | $5,345 | $423,500 | $83,500 | $340,000 |
| 2021 | $5,030 | $363,700 | $79,400 | $284,300 |
| 2020 | $4,484 | $310,300 | $78,200 | $232,100 |
| 2019 | $3,786 | $259,700 | $75,300 | $184,400 |
| 2018 | $3,509 | $240,000 | $81,600 | $158,400 |
| 2017 | $3,307 | $236,200 | $77,800 | $158,400 |
| 2016 | $3,234 | $237,300 | $82,800 | $154,500 |
| 2015 | $3,104 | $237,300 | $82,800 | $154,500 |
| 2014 | $3,137 | $249,400 | $80,300 | $169,100 |
Source: Public Records
Map
Nearby Homes
- 139 Quarry St
- 869 Bedford St
- 84 Healy St
- 105 16th St
- 120 15th St Unit 5
- 10 Carlisa Dr
- 129 County St
- 847 Pleasant St
- 992 Pine St
- 217 Plain St
- 218 Plain St
- 1155-1157 Pleasant St
- 88 Harrison St Unit 5
- 1244 Pleasant St
- 70 Jencks St
- 884 Cherry St
- 273 Tremont St
- 243 Robeson St Unit 6
- 243 Robeson St Unit 3
- 243 Oak Grove Ave
Your Personal Tour Guide
Ask me questions while you tour the home.