1 Daniel Dr Englewood, NJ 07631
Estimated Value: $963,768 - $1,313,000
Studio
--
Bath
2,278
Sq Ft
$490/Sq Ft
Est. Value
About This Home
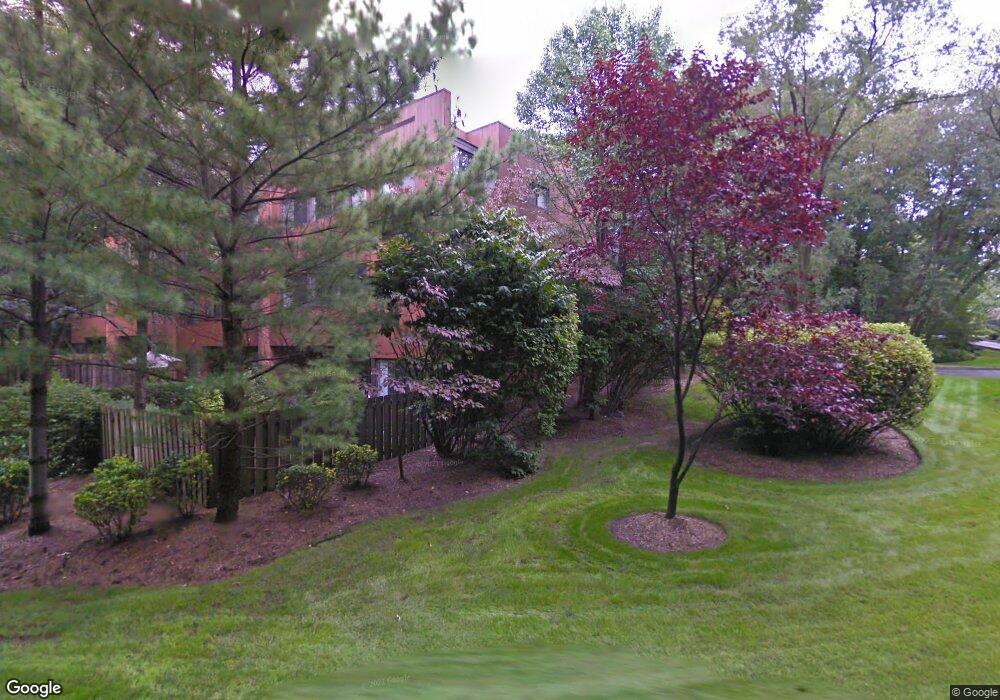
This home is located at 1 Daniel Dr, Englewood, NJ 07631 and is currently estimated at $1,116,589, approximately $490 per square foot. 1 Daniel Dr is a home located in Bergen County with nearby schools including Dr J Grieco Elementary School, Dr Mccloud Elementary School, and J.E. Dismus Middle School.
Ownership History
Date
Name
Owned For
Owner Type
Purchase Details
Closed on
Feb 28, 2014
Sold by
Harris Jane A
Bought by
Faber Wayne T and Faber Betty G
Current Estimated Value
Home Financials for this Owner
Home Financials are based on the most recent Mortgage that was taken out on this home.
Original Mortgage
$656,000
Outstanding Balance
$473,833
Interest Rate
3.15%
Mortgage Type
Stand Alone Refi Refinance Of Original Loan
Estimated Equity
$642,756
Purchase Details
Closed on
Apr 29, 2010
Sold by
Juhn Eunice
Bought by
Harris Jane A
Purchase Details
Closed on
Jul 10, 2002
Sold by
Fink Lawrence R
Bought by
Oh Hyun M
Home Financials for this Owner
Home Financials are based on the most recent Mortgage that was taken out on this home.
Original Mortgage
$300,000
Interest Rate
6.73%
Mortgage Type
Purchase Money Mortgage
Create a Home Valuation Report for This Property
The Home Valuation Report is an in-depth analysis detailing your home's value as well as a comparison with similar homes in the area
Home Values in the Area
Average Home Value in this Area
Purchase History
| Date | Buyer | Sale Price | Title Company |
|---|---|---|---|
| Faber Wayne T | $860,000 | -- | |
| Harris Jane A | $699,900 | -- | |
| Oh Hyun M | $550,000 | -- |
Source: Public Records
Mortgage History
| Date | Status | Borrower | Loan Amount |
|---|---|---|---|
| Open | Faber Wayne T | $656,000 | |
| Previous Owner | Oh Hyun M | $300,000 |
Source: Public Records
Tax History
| Year | Tax Paid | Tax Assessment Tax Assessment Total Assessment is a certain percentage of the fair market value that is determined by local assessors to be the total taxable value of land and additions on the property. | Land | Improvement |
|---|---|---|---|---|
| 2025 | $20,104 | $654,200 | $415,000 | $239,200 |
| 2024 | $19,495 | $654,200 | $415,000 | $239,200 |
| 2023 | $19,292 | $654,200 | $415,000 | $239,200 |
| 2022 | $19,039 | $645,600 | $415,000 | $230,600 |
| 2021 | $18,658 | $645,600 | $415,000 | $230,600 |
| 2020 | $18,174 | $645,600 | $415,000 | $230,600 |
| 2019 | $18,006 | $645,600 | $415,000 | $230,600 |
| 2018 | $17,573 | $645,600 | $415,000 | $230,600 |
| 2017 | $17,050 | $645,600 | $415,000 | $230,600 |
| 2016 | $16,508 | $645,600 | $415,000 | $230,600 |
| 2015 | $16,366 | $645,600 | $415,000 | $230,600 |
| 2014 | $16,230 | $645,600 | $415,000 | $230,600 |
Source: Public Records
Map
Nearby Homes
- 365 Forest Dr
- 48 S Woodland St
- 394 E Palisade Ave
- 320 Bolz St
- 316 Bolz St
- 312 Bolz St
- 45 Marjorie Terrace
- 140 Demarest Ave
- 144 Demarest Ave
- 111 Demarest Ave
- 285 Maple St
- 292 Maple St
- 45 Beech Rd
- 577 Floyd St
- 2 Maple St
- 278 Fountain Rd
- 285 Arch Rd
- 215 Brinckerhoff Ct
- 51 Lexington Ct
- 231 N Woodland St
Your Personal Tour Guide
Ask me questions while you tour the home.