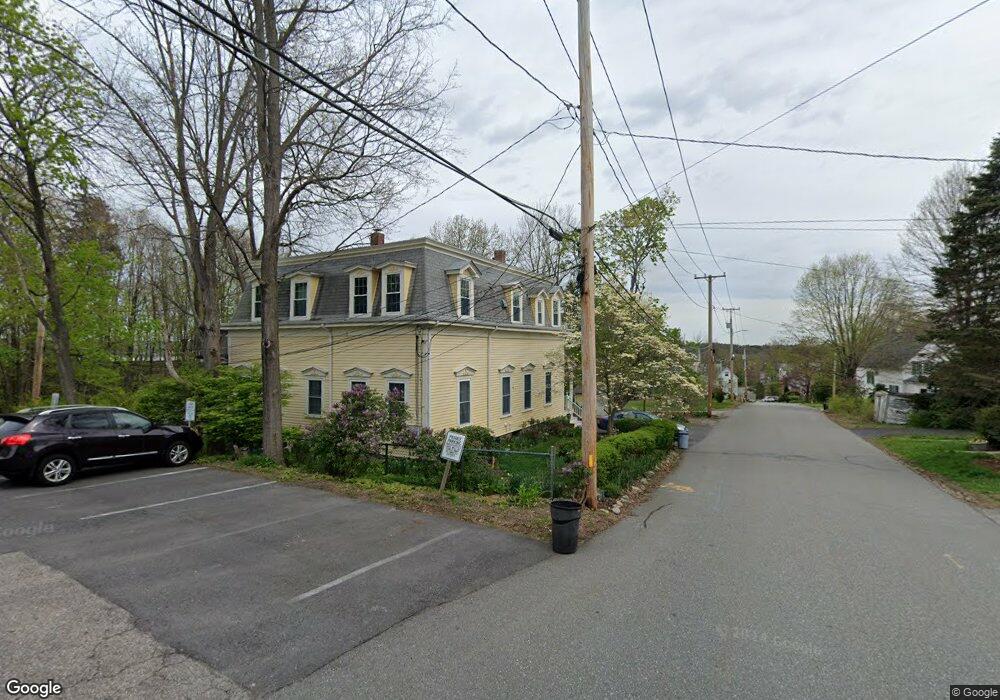
1 Dartmouth Ct Unit 3 Maynard, MA 01754
Estimated Value: $353,090 - $434,000
3
Beds
1
Bath
1,096
Sq Ft
$362/Sq Ft
Est. Value
About This Home
This home is located at 1 Dartmouth Ct Unit 3, Maynard, MA 01754 and is currently estimated at $396,773, approximately $362 per square foot. 1 Dartmouth Ct Unit 3 is a home located in Middlesex County with nearby schools including Green Meadow School, Fowler School, and Maynard High School.
Ownership History
Date
Name
Owned For
Owner Type
Purchase Details
Closed on
Aug 14, 2017
Sold by
Deutsche Bk Natl T Co
Bought by
Tryba Rachel
Current Estimated Value
Purchase Details
Closed on
May 3, 2016
Sold by
Dirico Donald A
Bought by
Deutsche Bk Natl T Co
Create a Home Valuation Report for This Property
The Home Valuation Report is an in-depth analysis detailing your home's value as well as a comparison with similar homes in the area
Home Values in the Area
Average Home Value in this Area
Purchase History
| Date | Buyer | Sale Price | Title Company |
|---|---|---|---|
| Tryba Rachel | $189,444 | -- | |
| Deutsche Bk Natl T Co | $220,000 | -- |
Source: Public Records
Tax History Compared to Growth
Tax History
| Year | Tax Paid | Tax Assessment Tax Assessment Total Assessment is a certain percentage of the fair market value that is determined by local assessors to be the total taxable value of land and additions on the property. | Land | Improvement |
|---|---|---|---|---|
| 2025 | $4,695 | $263,300 | $0 | $263,300 |
| 2024 | $4,232 | $236,700 | $0 | $236,700 |
| 2023 | $4,276 | $225,400 | $0 | $225,400 |
| 2022 | $4,759 | $231,900 | $0 | $231,900 |
| 2021 | $4,564 | $226,500 | $0 | $226,500 |
| 2020 | $5,540 | $268,400 | $0 | $268,400 |
| 2019 | $5,172 | $245,800 | $0 | $245,800 |
| 2018 | $5,748 | $253,900 | $0 | $253,900 |
| 2017 | $5,630 | $255,800 | $0 | $255,800 |
| 2016 | $5,160 | $242,800 | $0 | $242,800 |
| 2015 | $5,417 | $242,800 | $0 | $242,800 |
| 2014 | $4,946 | $221,900 | $0 | $221,900 |
Source: Public Records
Map
Nearby Homes
- 30-32 Walnut St
- 13 Arthur St Unit 15
- 15 Arthur St Unit 15
- 30 Acton St
- 2 Wall Ct
- 22-26 Waltham St
- 28 Waltham St Unit A
- 28 Waltham St Unit B
- 5 Hayes St Unit 5
- 91 Nason St
- 37 Glendale St
- 17 Prospect St
- 12 Walcott St
- 49 Summer Hill Rd
- 10 Mill St Unit Q
- 10 Mill St Unit B
- 250 Great Rd
- 66 Powder Mill Rd
- 7 King St
- 69 Powder Mill Rd
- 1 Dartmouth Ct Unit 2
- 1 Dartmouth Ct
- 1 Dartmouth Ct Unit 1
- 17 Dartmouth St
- 4 Dartmouth Ct Unit 4
- 9-11 Dartmouth St
- 11 Dartmouth St Unit A
- 11 Dartmouth St Unit B
- 9 Dartmouth St Unit B
- 9 Dartmouth St Unit A
- 13 Dartmouth St
- 13 Dartmouth St
- 13 B Dartmouth St Unit B
- 13 Dartmouth St Unit B
- 19 Dartmouth St
- 19 Dartmouth St Unit 1
- 19 Dartmouth St Unit 2
- 21 Dartmouth St
- 14 Dartmouth St Unit 3
- 18 Dartmouth St