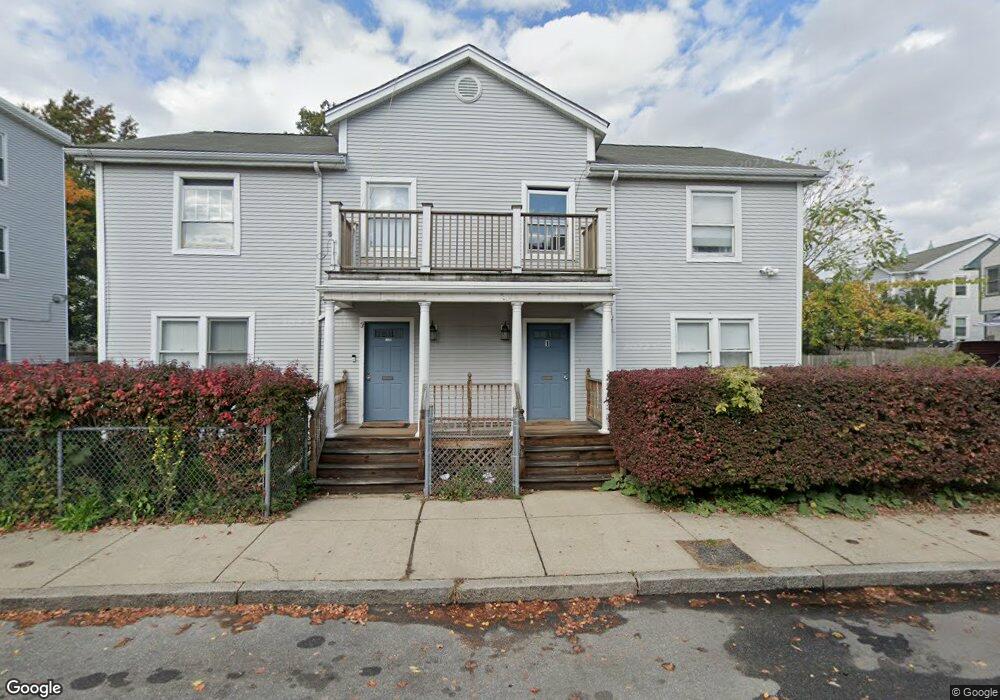
1 Dennis St Roxbury, MA 02119
Dudley-Brunswick King NeighborhoodEstimated Value: $363,000 - $533,000
3
Beds
2
Baths
1,566
Sq Ft
$278/Sq Ft
Est. Value
About This Home
This home is located at 1 Dennis St, Roxbury, MA 02119 and is currently estimated at $435,534, approximately $278 per square foot. 1 Dennis St is a home located in Suffolk County with nearby schools including Dudley Street Neighborhood Charter School and City on a Hill Charter Public School.
Ownership History
Date
Name
Owned For
Owner Type
Purchase Details
Closed on
Aug 12, 2016
Sold by
Dni Winthrop Estates L
Bought by
Holdi Dudley Neighbors
Current Estimated Value
Purchase Details
Closed on
Dec 30, 2005
Sold by
Dudley Neighbors Inc
Bought by
Dni Winthrop Ests Llc
Create a Home Valuation Report for This Property
The Home Valuation Report is an in-depth analysis detailing your home's value as well as a comparison with similar homes in the area
Home Values in the Area
Average Home Value in this Area
Purchase History
| Date | Buyer | Sale Price | Title Company |
|---|---|---|---|
| Holdi Dudley Neighbors | -- | -- | |
| Holdi Dudley Neighbors | -- | -- | |
| Dni Winthrop Ests Llc | -- | -- |
Source: Public Records
Tax History Compared to Growth
Tax History
| Year | Tax Paid | Tax Assessment Tax Assessment Total Assessment is a certain percentage of the fair market value that is determined by local assessors to be the total taxable value of land and additions on the property. | Land | Improvement |
|---|---|---|---|---|
| 2025 | $2,765 | $238,800 | $78,804 | $159,996 |
| 2024 | $2,479 | $227,400 | $61,398 | $166,002 |
| 2023 | $2,326 | $216,600 | $58,482 | $158,118 |
| 2022 | $2,245 | $206,300 | $55,701 | $150,599 |
| 2021 | $2,097 | $196,500 | $0 | $196,500 |
| 2020 | $1,976 | $187,104 | $81,300 | $105,804 |
| 2019 | $1,789 | $169,700 | $82,100 | $87,600 |
| 2018 | $1,694 | $161,600 | $82,100 | $79,500 |
| 2017 | $1,630 | $153,900 | $82,100 | $71,800 |
| 2016 | $1,613 | $146,600 | $82,100 | $64,500 |
| 2015 | $1,691 | $139,620 | $64,300 | $75,320 |
| 2014 | $1,673 | $132,971 | $64,300 | $68,671 |
Source: Public Records
Map
Nearby Homes
- 24 Clarence St Unit 24R
- 80 Blue Hill Ave Unit 5
- 108 Mount Pleasant Ave Unit 108R
- 101 Mount Pleasant Ave
- 45 Woodville St
- 79 W Cottage St
- 66 Burrell St
- 119 Blue Hill Ave
- 33 Copeland Park Unit C
- 69 Burrell St
- 22 Alaska St
- 21 Dean St
- 29 E Cottage St
- 133 Blue Hill Ave
- Lot 84 Blue Hill Ave
- 31 Alaska St
- 59 Perrin St
- 59 Perrin St Unit 1
- 7 Langford Park Unit 3
- 14 Robey St Unit 14