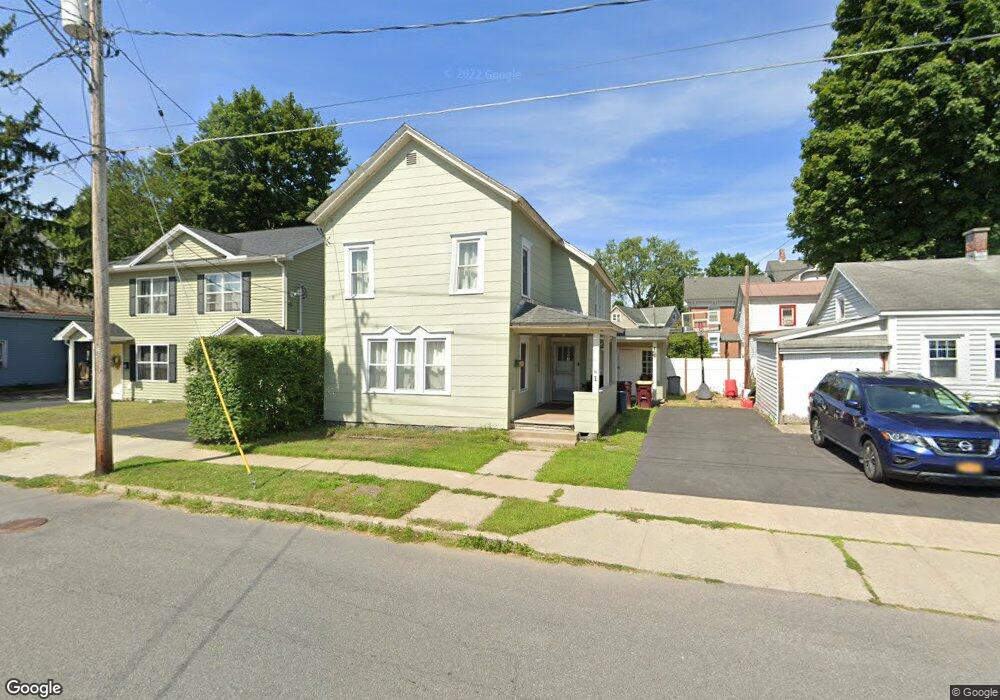
1 Division St Glens Falls, NY 12801
Estimated Value: $223,653 - $256,000
3
Beds
1
Bath
1,476
Sq Ft
$166/Sq Ft
Est. Value
About This Home
This home is located at 1 Division St, Glens Falls, NY 12801 and is currently estimated at $244,413, approximately $165 per square foot. 1 Division St is a home located in Warren County with nearby schools including Glens Falls Senior High School and St. Mary-St. Alphonsus Catholic School.
Ownership History
Date
Name
Owned For
Owner Type
Purchase Details
Closed on
Jun 21, 2024
Sold by
Guay Jeffrey D and Guay Ingrid T
Bought by
Guay Jeffrey D
Current Estimated Value
Home Financials for this Owner
Home Financials are based on the most recent Mortgage that was taken out on this home.
Original Mortgage
$64,000
Outstanding Balance
$63,056
Interest Rate
6.95%
Mortgage Type
New Conventional
Estimated Equity
$181,357
Create a Home Valuation Report for This Property
The Home Valuation Report is an in-depth analysis detailing your home's value as well as a comparison with similar homes in the area
Home Values in the Area
Average Home Value in this Area
Purchase History
| Date | Buyer | Sale Price | Title Company |
|---|---|---|---|
| Guay Jeffrey D | -- | First American Title | |
| Guay Jeffrey D | -- | First American Title | |
| Guay Jeffrey D | -- | First American Title |
Source: Public Records
Mortgage History
| Date | Status | Borrower | Loan Amount |
|---|---|---|---|
| Open | Guay Jeffrey D | $64,000 | |
| Closed | Guay Jeffrey D | $64,000 |
Source: Public Records
Tax History Compared to Growth
Tax History
| Year | Tax Paid | Tax Assessment Tax Assessment Total Assessment is a certain percentage of the fair market value that is determined by local assessors to be the total taxable value of land and additions on the property. | Land | Improvement |
|---|---|---|---|---|
| 2024 | $4,496 | $162,000 | $8,000 | $154,000 |
| 2023 | $4,418 | $154,300 | $8,000 | $146,300 |
| 2022 | $3,599 | $154,300 | $8,000 | $146,300 |
| 2021 | $2,654 | $60,000 | $9,900 | $50,100 |
| 2020 | $3,425 | $60,000 | $9,900 | $50,100 |
| 2019 | $1,422 | $60,000 | $9,900 | $50,100 |
| 2018 | $1,422 | $60,000 | $9,900 | $50,100 |
| 2017 | $1,404 | $60,000 | $9,900 | $50,100 |
| 2016 | $3,302 | $60,000 | $9,900 | $50,100 |
| 2015 | -- | $60,000 | $9,900 | $50,100 |
| 2014 | -- | $60,000 | $9,900 | $50,100 |
Source: Public Records
Map
Nearby Homes