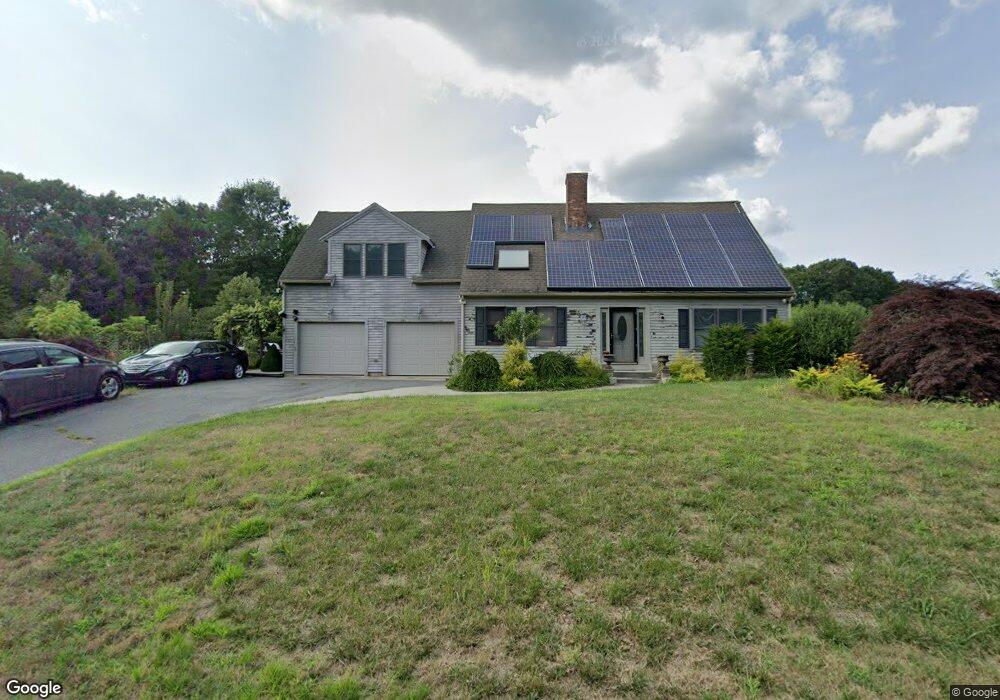
1 E Crossfield Rd Forestdale, MA 02644
Forestdale NeighborhoodEstimated Value: $672,000 - $846,000
3
Beds
3
Baths
1,862
Sq Ft
$403/Sq Ft
Est. Value
About This Home
This home is located at 1 E Crossfield Rd, Forestdale, MA 02644 and is currently estimated at $749,999, approximately $402 per square foot. 1 E Crossfield Rd is a home located in Barnstable County with nearby schools including Sandwich Middle High School and Montessori School of Sandwich.
Ownership History
Date
Name
Owned For
Owner Type
Purchase Details
Closed on
Jan 16, 2019
Sold by
Lee Kevin
Bought by
Lee Kevin and Lee Ming Z
Current Estimated Value
Purchase Details
Closed on
Jun 24, 2002
Sold by
Berard Marjorie M and Berard Glen W
Bought by
Lee Kevin
Home Financials for this Owner
Home Financials are based on the most recent Mortgage that was taken out on this home.
Original Mortgage
$218,250
Interest Rate
6.81%
Mortgage Type
Purchase Money Mortgage
Purchase Details
Closed on
Apr 25, 1996
Sold by
Canton Inst Svgs Bk
Bought by
Brown Isabelle
Home Financials for this Owner
Home Financials are based on the most recent Mortgage that was taken out on this home.
Original Mortgage
$57,500
Interest Rate
7.81%
Mortgage Type
Purchase Money Mortgage
Create a Home Valuation Report for This Property
The Home Valuation Report is an in-depth analysis detailing your home's value as well as a comparison with similar homes in the area
Home Values in the Area
Average Home Value in this Area
Purchase History
| Date | Buyer | Sale Price | Title Company |
|---|---|---|---|
| Lee Kevin | -- | None Available | |
| Lee Kevin | $242,500 | -- | |
| Brown Isabelle | $117,500 | -- |
Source: Public Records
Mortgage History
| Date | Status | Borrower | Loan Amount |
|---|---|---|---|
| Previous Owner | Lee Kevin | $218,250 | |
| Previous Owner | Brown Isabelle | $57,500 |
Source: Public Records
Tax History Compared to Growth
Tax History
| Year | Tax Paid | Tax Assessment Tax Assessment Total Assessment is a certain percentage of the fair market value that is determined by local assessors to be the total taxable value of land and additions on the property. | Land | Improvement |
|---|---|---|---|---|
| 2025 | $6,195 | $586,100 | $157,200 | $428,900 |
| 2024 | $6,021 | $557,500 | $140,400 | $417,100 |
| 2023 | $5,886 | $511,800 | $127,600 | $384,200 |
| 2022 | $5,611 | $426,400 | $116,500 | $309,900 |
| 2021 | $5,326 | $386,800 | $111,400 | $275,400 |
| 2020 | $5,356 | $374,300 | $113,000 | $261,300 |
| 2019 | $5,052 | $352,800 | $108,000 | $244,800 |
| 2018 | $4,784 | $334,800 | $107,100 | $227,700 |
| 2017 | $4,719 | $316,100 | $103,600 | $212,500 |
| 2016 | $4,487 | $310,100 | $100,400 | $209,700 |
| 2015 | $4,487 | $302,800 | $97,200 | $205,600 |
Source: Public Records
Map
Nearby Homes
- 21 Green Acres Ln
- 4 Faith Ln
- 39 Massachusetts 130
- 120 Snake Pond Rd
- 27 Craft Rd
- 37 Pickerel Way
- 76 Trout Brook Rd
- 99 Route 130
- 27 Dogwood Dr
- 38 Pierre Vernier Dr
- 18 Katian Way
- 15 Gunters Ln
- 86 Greenville Dr
- 8 Peters Pond Dr
- 35 Ashumet Rd Unit 11B
- 96 Pimlico Pond Rd
- 93 Deerfield Rd
- 9 Bramble Bush Dr
- 185 Cotuit Rd Unit BE4