1 E State Fair Highland Park, MI 48203
Nolan NeighborhoodEstimated Value: $413,400
Studio
--
Bath
3,654
Sq Ft
$113/Sq Ft
Est. Value
About This Home
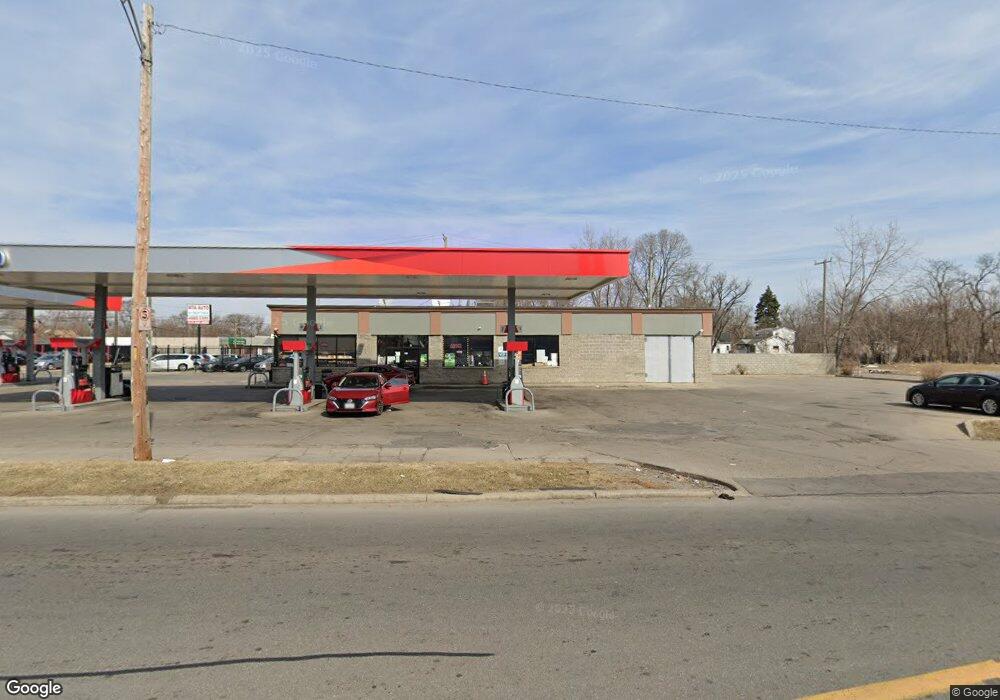
This home is located at 1 E State Fair, Highland Park, MI 48203 and is currently estimated at $413,400, approximately $113 per square foot. 1 E State Fair is a home located in Wayne County with nearby schools including Nolan Elementary/Middle School, Charles L. Spain Elementary-Middle School, and Edward 'Duke' Ellington Conservatory of Music and Art.
Ownership History
Date
Name
Owned For
Owner Type
Purchase Details
Closed on
Jun 6, 2016
Sold by
Lpi East State Fair Llc
Bought by
Alsabahi Investments Llc
Current Estimated Value
Purchase Details
Closed on
Dec 12, 2013
Sold by
1 East State Fair Llc
Bought by
Lpi East State Fair Llc
Purchase Details
Closed on
Mar 8, 2006
Sold by
Byblos Inc
Bought by
1 East State Fair Llc
Home Financials for this Owner
Home Financials are based on the most recent Mortgage that was taken out on this home.
Original Mortgage
$352,867
Interest Rate
6.33%
Mortgage Type
Commercial
Purchase Details
Closed on
Dec 22, 2003
Sold by
Dabaja Radwan and Dabaja Gladys
Bought by
Byblos Inc
Home Financials for this Owner
Home Financials are based on the most recent Mortgage that was taken out on this home.
Original Mortgage
$385,000
Interest Rate
5.91%
Mortgage Type
Commercial
Purchase Details
Closed on
Dec 13, 2000
Sold by
Yousif Alexander and Yousif Kathy
Bought by
Dabaja Radwan
Create a Home Valuation Report for This Property
The Home Valuation Report is an in-depth analysis detailing your home's value as well as a comparison with similar homes in the area
Home Values in the Area
Average Home Value in this Area
Purchase History
| Date | Buyer | Sale Price | Title Company |
|---|---|---|---|
| Alsabahi Investments Llc | $315,000 | None Available | |
| Lpi East State Fair Llc | $475,000 | None Available | |
| 1 East State Fair Llc | -- | Metropolitan Title Company | |
| Byblos Inc | -- | Metropolitan Title Company | |
| Dabaja Radwan | $250,000 | Metropolitan |
Source: Public Records
Mortgage History
| Date | Status | Borrower | Loan Amount |
|---|---|---|---|
| Previous Owner | 1 East State Fair Llc | $352,867 | |
| Previous Owner | Byblos Inc | $385,000 |
Source: Public Records
Tax History
| Year | Tax Paid | Tax Assessment Tax Assessment Total Assessment is a certain percentage of the fair market value that is determined by local assessors to be the total taxable value of land and additions on the property. | Land | Improvement |
|---|---|---|---|---|
| 2025 | $18,975 | $320,400 | $0 | $0 |
| 2024 | $18,820 | $307,400 | $0 | $0 |
| 2023 | $18,320 | $286,800 | $0 | $0 |
| 2022 | $23,311 | $257,000 | $0 | $0 |
| 2021 | $22,335 | $218,200 | $0 | $0 |
| 2020 | $22,089 | $233,800 | $0 | $0 |
| 2019 | $19,067 | $231,300 | $0 | $0 |
| 2018 | $16,215 | $230,400 | $0 | $0 |
| 2017 | $3,889 | $230,100 | $0 | $0 |
| 2016 | $20,270 | $183,200 | $0 | $0 |
| 2015 | $22,670 | $226,700 | $0 | $0 |
| 2013 | $22,673 | $226,725 | $0 | $0 |
| 2010 | -- | $244,176 | $13,901 | $230,275 |
Source: Public Records
Map
Nearby Homes
- 20004 Coventry St
- 20035 Coventry St
- 19953 Andover St
- 20027 Derby St
- 19673 Irvington St
- 19642 Irvington St
- 19628 Danbury St
- 20070 Irvington St
- 20165 Irvington St
- 20188 Andover St
- 20208 Andover St
- 19326 Andover St
- 474 Adeline St
- 19375 Danbury St
- 20322 Charleston St
- 528 Adeline St
- 19312 Danbury St
- 20251 Omira St
- 20515 Coventry St
- 20516 Andover St
- 19933 Coventry St
- 19941 Coventry St
- 36 E State Fair
- 19790 John R St
- 19947 Coventry St
- 19926 Coventry St
- 19956 John R St
- 19932 Coventry St
- 19955 Coventry St
- 19733 Coventry St
- 19961 Coventry St
- 304 E State Fair
- 19729 Coventry St
- 19940 Coventry St
- 19969 Coventry St
- 19948 Coventry St
- 19954 Coventry St
- 19975 Coventry St
- 19715 Coventry St
- 19960 Coventry St
Your Personal Tour Guide
Ask me questions while you tour the home.