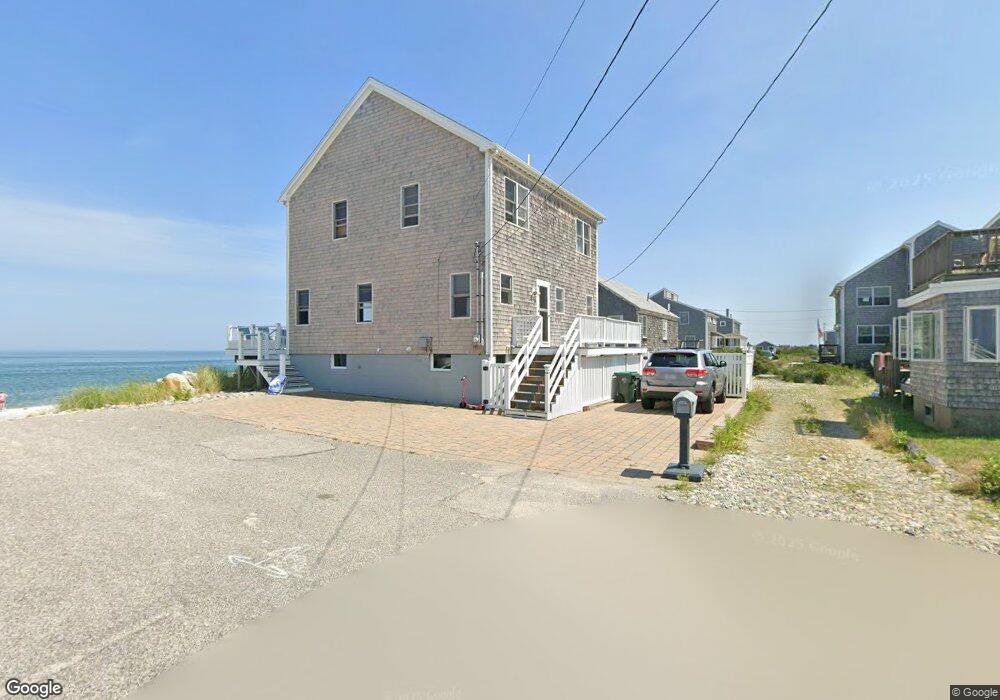
1 East St Unit 1 Marshfield, MA 02050
Ocean Bluff-Brant Rock NeighborhoodEstimated Value: $933,000 - $1,330,000
5
Beds
2
Baths
1,624
Sq Ft
$724/Sq Ft
Est. Value
About This Home
This home is located at 1 East St Unit 1, Marshfield, MA 02050 and is currently estimated at $1,176,573, approximately $724 per square foot. 1 East St Unit 1 is a home located in Plymouth County with nearby schools including Daniel Webster, Furnace Brook Middle School, and Marshfield High School.
Ownership History
Date
Name
Owned For
Owner Type
Purchase Details
Closed on
Mar 19, 2025
Sold by
Daichman Linda E
Bought by
Rex Summer T and Rex Daichman
Current Estimated Value
Purchase Details
Closed on
Feb 26, 2024
Sold by
Daichman Management T and Daichman
Bought by
Daichman Linda E
Purchase Details
Closed on
Jun 17, 2013
Sold by
1 East Street Rt and Shaw
Bought by
Daichman Mgmt T and Daichman
Purchase Details
Closed on
Dec 29, 2004
Sold by
1 East Street Rt and Shaw
Bought by
Shaw Annette and Bishop Mary
Create a Home Valuation Report for This Property
The Home Valuation Report is an in-depth analysis detailing your home's value as well as a comparison with similar homes in the area
Home Values in the Area
Average Home Value in this Area
Purchase History
| Date | Buyer | Sale Price | Title Company |
|---|---|---|---|
| Rex Summer T | -- | None Available | |
| Daichman Linda E | -- | None Available | |
| Daichman Linda E | -- | None Available | |
| Daichman Mgmt T | $740,000 | -- | |
| Daichman Mgmt T | $740,000 | -- | |
| Shaw Annette | -- | -- | |
| Shaw Annette | -- | -- |
Source: Public Records
Tax History Compared to Growth
Tax History
| Year | Tax Paid | Tax Assessment Tax Assessment Total Assessment is a certain percentage of the fair market value that is determined by local assessors to be the total taxable value of land and additions on the property. | Land | Improvement |
|---|---|---|---|---|
| 2025 | $11,275 | $1,138,900 | $833,800 | $305,100 |
| 2024 | $10,721 | $1,031,900 | $754,400 | $277,500 |
| 2023 | $9,705 | $955,500 | $714,700 | $240,800 |
| 2022 | $9,705 | $749,400 | $545,900 | $203,500 |
| 2021 | $8,567 | $649,500 | $466,500 | $183,000 |
| 2020 | $8,191 | $614,500 | $436,700 | $177,800 |
| 2019 | $8,086 | $604,300 | $436,700 | $167,600 |
| 2018 | $8,023 | $600,100 | $436,700 | $163,400 |
| 2017 | $7,997 | $582,900 | $436,700 | $146,200 |
| 2016 | $7,949 | $572,700 | $436,700 | $136,000 |
| 2015 | $8,623 | $648,800 | $516,200 | $132,600 |
| 2014 | $7,581 | $570,400 | $476,400 | $94,000 |
Source: Public Records
Map
Nearby Homes