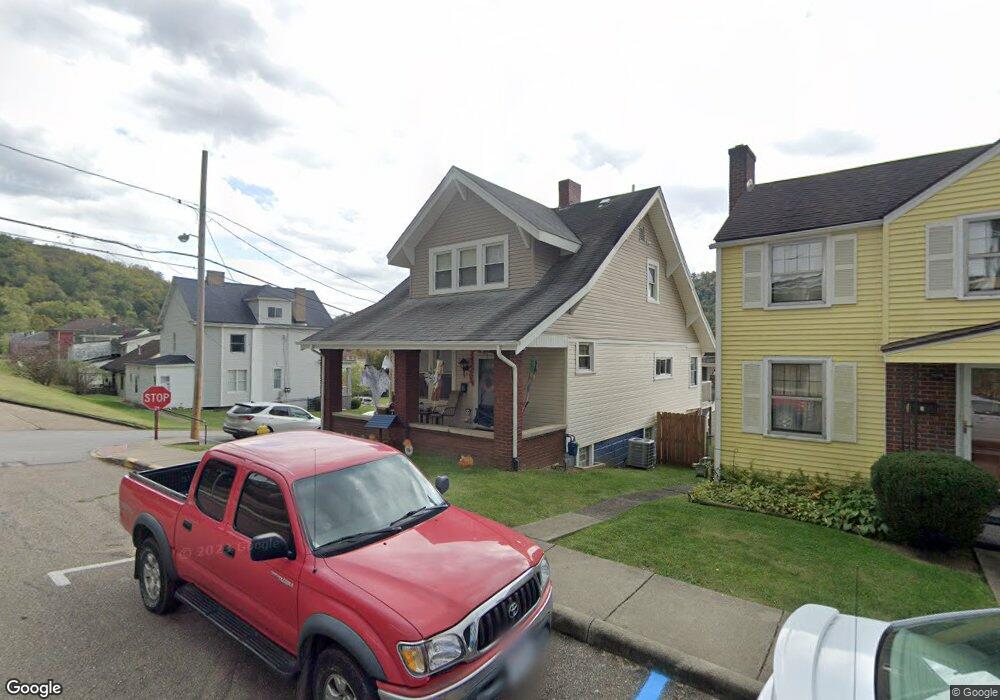
1 Elm St Bridgeport, OH 43912
Estimated Value: $87,000 - $193,000
2
Beds
1
Bath
1,344
Sq Ft
$107/Sq Ft
Est. Value
About This Home
This home is located at 1 Elm St, Bridgeport, OH 43912 and is currently estimated at $143,645, approximately $106 per square foot. 1 Elm St is a home located in Belmont County with nearby schools including Bridgeport Elementary School, Bridgeport Middle School, and Bridgeport High School.
Ownership History
Date
Name
Owned For
Owner Type
Purchase Details
Closed on
Oct 7, 2024
Sold by
Frazier Melissa Ann and Kupske Melissa Ann
Bought by
Frazier Melissa Ann
Current Estimated Value
Home Financials for this Owner
Home Financials are based on the most recent Mortgage that was taken out on this home.
Original Mortgage
$27,000
Outstanding Balance
$25,890
Interest Rate
5.27%
Mortgage Type
Credit Line Revolving
Estimated Equity
$117,755
Purchase Details
Closed on
Jul 11, 2007
Sold by
Creer Robert J and Creer Melissa K
Bought by
Kupske Melissa Ann
Home Financials for this Owner
Home Financials are based on the most recent Mortgage that was taken out on this home.
Original Mortgage
$64,260
Interest Rate
6.76%
Mortgage Type
Purchase Money Mortgage
Purchase Details
Closed on
Apr 20, 1994
Sold by
Creer Robert J
Bought by
Creer Robert J
Purchase Details
Closed on
Jan 1, 1986
Sold by
Ellis David J
Bought by
Ellis David J
Create a Home Valuation Report for This Property
The Home Valuation Report is an in-depth analysis detailing your home's value as well as a comparison with similar homes in the area
Home Values in the Area
Average Home Value in this Area
Purchase History
| Date | Buyer | Sale Price | Title Company |
|---|---|---|---|
| Frazier Melissa Ann | -- | None Listed On Document | |
| Frazier Melissa Ann | -- | None Listed On Document | |
| Kupske Melissa Ann | $63,000 | Attorney | |
| Creer Robert J | $32,500 | -- | |
| Ellis David J | -- | -- |
Source: Public Records
Mortgage History
| Date | Status | Borrower | Loan Amount |
|---|---|---|---|
| Open | Frazier Melissa Ann | $27,000 | |
| Closed | Frazier Melissa Ann | $27,000 | |
| Previous Owner | Kupske Melissa Ann | $64,260 |
Source: Public Records
Tax History Compared to Growth
Tax History
| Year | Tax Paid | Tax Assessment Tax Assessment Total Assessment is a certain percentage of the fair market value that is determined by local assessors to be the total taxable value of land and additions on the property. | Land | Improvement |
|---|---|---|---|---|
| 2024 | $1,398 | $37,840 | $2,640 | $35,200 |
| 2023 | $1,401 | $34,250 | $2,640 | $31,610 |
| 2022 | $1,400 | $34,247 | $2,639 | $31,608 |
| 2021 | $1,421 | $34,247 | $2,639 | $31,608 |
| 2020 | $1,231 | $29,790 | $2,300 | $27,490 |
| 2019 | $1,233 | $29,790 | $2,300 | $27,490 |
| 2018 | $1,261 | $29,790 | $2,300 | $27,490 |
| 2017 | $1,245 | $27,290 | $2,030 | $25,260 |
| 2016 | $1,222 | $27,290 | $2,030 | $25,260 |
| 2015 | $1,217 | $27,290 | $2,030 | $25,260 |
| 2014 | $1,240 | $27,110 | $1,850 | $25,260 |
| 2013 | $1,183 | $27,110 | $1,850 | $25,260 |
Source: Public Records
Map
Nearby Homes
- 26 Elm St
- 902 National Rd
- 4 Walnut Ave
- 56316 National Rd
- 866 Main St
- 836 Main St
- 56624 Boyd Ave
- 56065 National Rd
- 1123 Minellen Dr
- 824 Howard St
- 822 W Bennett St
- 629 1/2 Howard St
- 69142 Woods Rd
- 67478 Kirkwood Heights Rd
- 67531 Kirkwood Heights Rd
- 308 Whitely St
- 244 Lombardy Heights
- 55500 National Rd
- 55490 National Rd
- 55480 National Rd