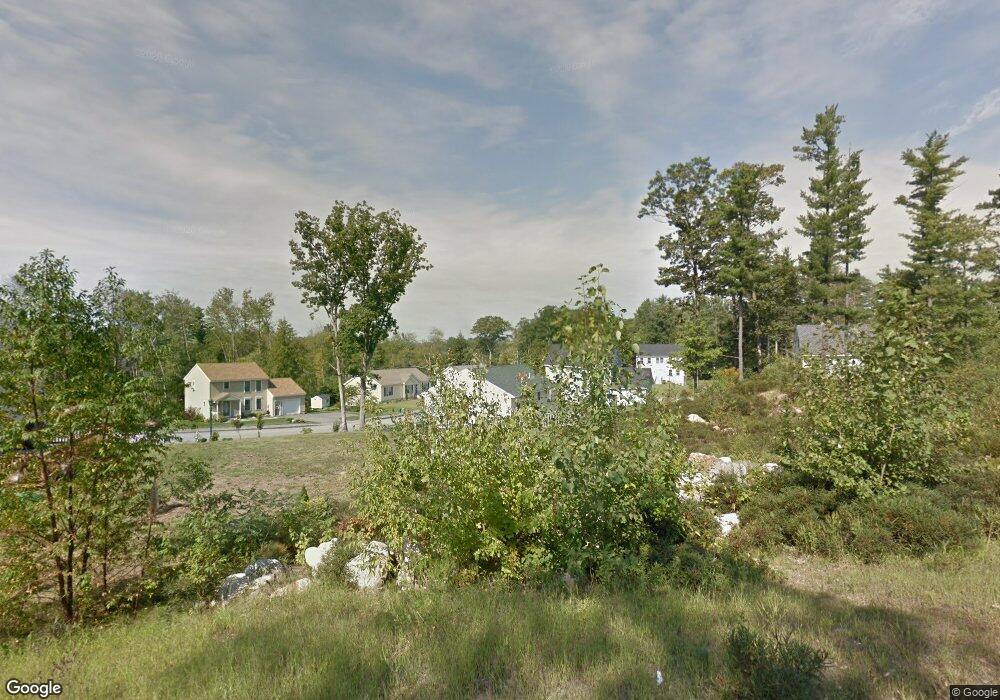
1 Emerald Ct Berwick, ME 03901
Estimated Value: $498,000 - $537,000
3
Beds
3
Baths
1,638
Sq Ft
$317/Sq Ft
Est. Value
About This Home
This home is located at 1 Emerald Ct, Berwick, ME 03901 and is currently estimated at $519,169, approximately $316 per square foot. 1 Emerald Ct is a home located in York County with nearby schools including Noble High School and Tri-City Christian Academy.
Ownership History
Date
Name
Owned For
Owner Type
Purchase Details
Closed on
Oct 2, 2006
Sold by
Corliss John L
Bought by
Sewell Jennifer N and Sewell Martin J
Current Estimated Value
Home Financials for this Owner
Home Financials are based on the most recent Mortgage that was taken out on this home.
Original Mortgage
$212,000
Interest Rate
6.52%
Mortgage Type
Purchase Money Mortgage
Create a Home Valuation Report for This Property
The Home Valuation Report is an in-depth analysis detailing your home's value as well as a comparison with similar homes in the area
Home Values in the Area
Average Home Value in this Area
Purchase History
| Date | Buyer | Sale Price | Title Company |
|---|---|---|---|
| Sewell Jennifer N | -- | -- | |
| Sewell Jennifer N | -- | -- | |
| Sewell Jennifer N | -- | -- |
Source: Public Records
Mortgage History
| Date | Status | Borrower | Loan Amount |
|---|---|---|---|
| Open | Sewell Jennifer N | $208,058 | |
| Closed | Sewell Jennifer N | $212,000 |
Source: Public Records
Tax History
| Year | Tax Paid | Tax Assessment Tax Assessment Total Assessment is a certain percentage of the fair market value that is determined by local assessors to be the total taxable value of land and additions on the property. | Land | Improvement |
|---|---|---|---|---|
| 2025 | $5,773 | $442,700 | $162,500 | $280,200 |
| 2024 | $5,520 | $442,700 | $162,500 | $280,200 |
| 2023 | $4,923 | $268,700 | $89,500 | $179,200 |
| 2022 | $4,896 | $268,700 | $89,500 | $179,200 |
| 2021 | $4,917 | $268,700 | $89,500 | $179,200 |
| 2020 | $5,210 | $269,100 | $89,500 | $179,600 |
| 2019 | $4,717 | $269,100 | $89,500 | $179,600 |
| 2018 | $4,611 | $262,000 | $81,200 | $180,800 |
| 2017 | $4,493 | $262,000 | $81,200 | $180,800 |
| 2016 | $4,271 | $262,000 | $81,200 | $180,800 |
| 2014 | $4,166 | $262,000 | $81,200 | $180,800 |
| 2013 | $4,205 | $262,000 | $81,200 | $180,800 |
Source: Public Records
Map
Nearby Homes
Your Personal Tour Guide
Ask me questions while you tour the home.