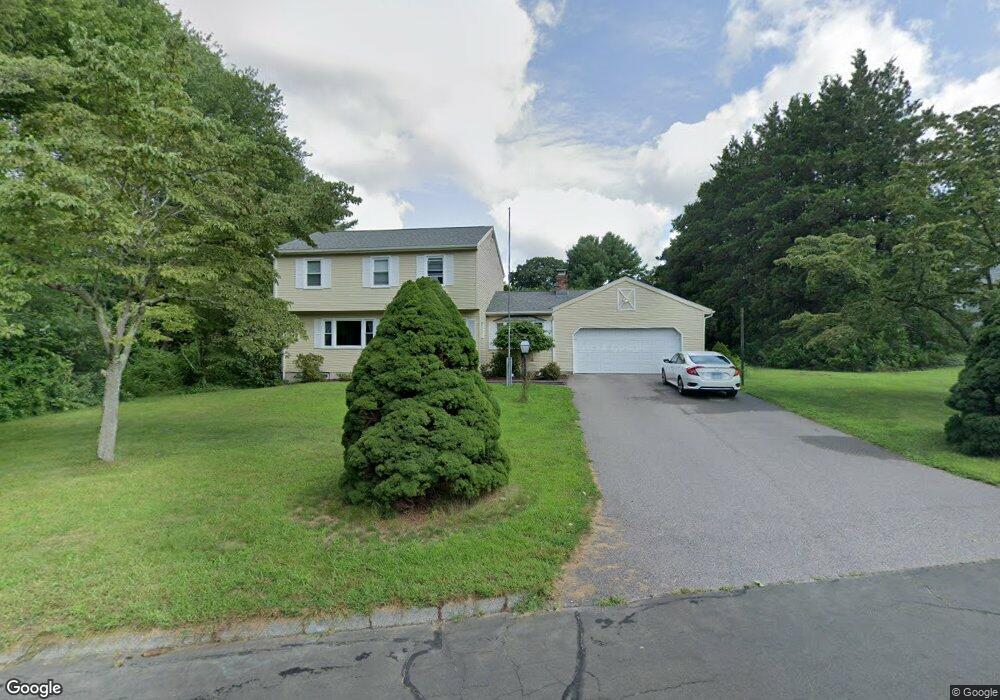
1 Enid Rd East Lyme, CT 06333
Estimated Value: $466,000 - $530,000
3
Beds
3
Baths
1,680
Sq Ft
$291/Sq Ft
Est. Value
About This Home
This home is located at 1 Enid Rd, East Lyme, CT 06333 and is currently estimated at $488,376, approximately $290 per square foot. 1 Enid Rd is a home located in New London County with nearby schools including East Lyme Middle School, East Lyme High School, and Carelot Children's Center - East Lyme.
Ownership History
Date
Name
Owned For
Owner Type
Purchase Details
Closed on
Jan 7, 2022
Sold by
Resnisky James F and Resnisky Julie G
Bought by
Quick Marie J
Current Estimated Value
Home Financials for this Owner
Home Financials are based on the most recent Mortgage that was taken out on this home.
Original Mortgage
$184,000
Outstanding Balance
$169,601
Interest Rate
3.12%
Mortgage Type
Purchase Money Mortgage
Estimated Equity
$318,775
Purchase Details
Closed on
Mar 26, 2001
Sold by
Scherber Keith W
Bought by
Keating John P and Keating Amy J
Purchase Details
Closed on
Jul 28, 1999
Sold by
Desfosses Wayne J and Desfosses Stacie P
Bought by
Scherber Keith W and Scherber Lisa M
Purchase Details
Closed on
Jan 7, 1998
Sold by
Bonnett Richard and Bonnett Leatrice
Bought by
Desfosses Wayne J and Desfosses Stacie P
Create a Home Valuation Report for This Property
The Home Valuation Report is an in-depth analysis detailing your home's value as well as a comparison with similar homes in the area
Home Values in the Area
Average Home Value in this Area
Purchase History
| Date | Buyer | Sale Price | Title Company |
|---|---|---|---|
| Quick Marie J | $389,000 | None Available | |
| Keating John P | $197,000 | -- | |
| Scherber Keith W | $189,000 | -- | |
| Desfosses Wayne J | $167,000 | -- | |
| Bonnett Richard | $148,900 | -- | |
| Keating John P | $197,000 | -- | |
| Scherber Keith W | $189,000 | -- |
Source: Public Records
Mortgage History
| Date | Status | Borrower | Loan Amount |
|---|---|---|---|
| Open | Quick Marie J | $184,000 | |
| Previous Owner | Bonnett Richard | $243,000 | |
| Previous Owner | Bonnett Richard | $250,000 |
Source: Public Records
Tax History Compared to Growth
Tax History
| Year | Tax Paid | Tax Assessment Tax Assessment Total Assessment is a certain percentage of the fair market value that is determined by local assessors to be the total taxable value of land and additions on the property. | Land | Improvement |
|---|---|---|---|---|
| 2025 | $6,061 | $216,370 | $85,750 | $130,620 |
| 2024 | $5,701 | $216,370 | $85,750 | $130,620 |
| 2023 | $5,383 | $216,370 | $85,750 | $130,620 |
| 2022 | $5,158 | $216,370 | $85,750 | $130,620 |
| 2021 | $5,219 | $183,050 | $77,560 | $105,490 |
| 2020 | $5,191 | $183,050 | $77,560 | $105,490 |
| 2019 | $5,160 | $183,050 | $77,560 | $105,490 |
| 2018 | $5,006 | $183,050 | $77,560 | $105,490 |
| 2017 | $4,789 | $183,050 | $77,560 | $105,490 |
| 2016 | $4,610 | $181,790 | $77,560 | $104,230 |
| 2015 | $4,492 | $181,790 | $77,560 | $104,230 |
| 2014 | $4,368 | $181,790 | $77,560 | $104,230 |
Source: Public Records
Map
Nearby Homes
- 43 Mayfield Terrace
- 48 Quailcrest Rd
- 15 Rocco Dr
- 0 Chesterfield Rd
- 12 Brookfield Dr
- 14 Irvingdell Place
- 29 Rocco Dr
- 0 Cedarbrook Ln Unit 24110327
- 1 Hathaway Rd
- 10 Filosi Rd
- 18 Sandpiper Ln
- 32 Upper Pattagansett Rd Unit 8
- 231 Boston Post Rd Unit 9
- 57 Walnut Hill Rd
- 33 Arbor Crossing
- 138 Boston Post Rd Unit 10
- 138 Boston Post Rd Unit 11
- 138 Boston Post Rd Unit 16
- 138 Boston Post Rd Unit 17
- 138 Boston Post Rd Unit 3