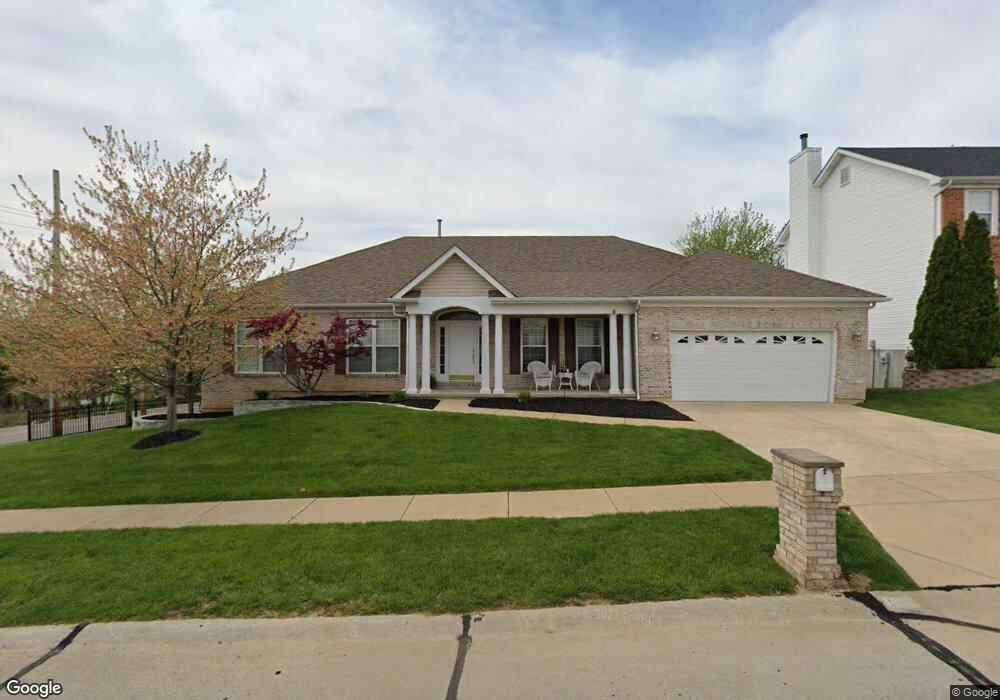
1 Fairview Place Fenton, MO 63026
Estimated Value: $455,543 - $523,000
3
Beds
3
Baths
2,465
Sq Ft
$199/Sq Ft
Est. Value
About This Home
This home is located at 1 Fairview Place, Fenton, MO 63026 and is currently estimated at $491,636, approximately $199 per square foot. 1 Fairview Place is a home located in St. Louis County with nearby schools including Concord Elementary School, Sperreng Middle School, and Lindbergh High School.
Ownership History
Date
Name
Owned For
Owner Type
Purchase Details
Closed on
Nov 29, 2021
Sold by
Martin Raaf Nichole
Bought by
Shortt Dave and Sherrell-Shortt Tammy
Current Estimated Value
Home Financials for this Owner
Home Financials are based on the most recent Mortgage that was taken out on this home.
Original Mortgage
$313,500
Outstanding Balance
$287,863
Interest Rate
3.14%
Mortgage Type
New Conventional
Estimated Equity
$203,773
Purchase Details
Closed on
Nov 4, 2005
Sold by
Sherrell Tammy L
Bought by
Raaf Robert E
Home Financials for this Owner
Home Financials are based on the most recent Mortgage that was taken out on this home.
Original Mortgage
$318,750
Interest Rate
5.9%
Mortgage Type
Fannie Mae Freddie Mac
Purchase Details
Closed on
Feb 22, 2001
Sold by
E & M Development Company
Bought by
Sherrell Tammy L
Home Financials for this Owner
Home Financials are based on the most recent Mortgage that was taken out on this home.
Original Mortgage
$240,200
Interest Rate
6.97%
Create a Home Valuation Report for This Property
The Home Valuation Report is an in-depth analysis detailing your home's value as well as a comparison with similar homes in the area
Home Values in the Area
Average Home Value in this Area
Purchase History
| Date | Buyer | Sale Price | Title Company |
|---|---|---|---|
| Shortt Dave | -- | None Listed On Document | |
| Raaf Robert E | $375,000 | Ort | |
| Sherrell Tammy L | $240,200 | Land Title Company | |
| Sherrell Tammy L | -- | Land Title Company |
Source: Public Records
Mortgage History
| Date | Status | Borrower | Loan Amount |
|---|---|---|---|
| Open | Shortt Dave | $313,500 | |
| Previous Owner | Raaf Robert E | $318,750 | |
| Previous Owner | Sherrell Tammy L | $240,200 |
Source: Public Records
Tax History Compared to Growth
Tax History
| Year | Tax Paid | Tax Assessment Tax Assessment Total Assessment is a certain percentage of the fair market value that is determined by local assessors to be the total taxable value of land and additions on the property. | Land | Improvement |
|---|---|---|---|---|
| 2025 | $5,741 | $96,090 | $28,790 | $67,300 |
| 2024 | $5,741 | $80,390 | $19,190 | $61,200 |
| 2023 | $5,729 | $80,390 | $19,190 | $61,200 |
| 2022 | $5,438 | $73,360 | $15,980 | $57,380 |
| 2021 | $5,410 | $73,360 | $15,980 | $57,380 |
| 2020 | $4,885 | $63,920 | $12,810 | $51,110 |
| 2019 | $4,872 | $63,920 | $12,810 | $51,110 |
| 2018 | $5,034 | $61,770 | $11,190 | $50,580 |
| 2017 | $4,981 | $61,770 | $11,190 | $50,580 |
| 2016 | $4,554 | $56,520 | $11,190 | $45,330 |
| 2015 | $4,493 | $56,520 | $11,190 | $45,330 |
| 2014 | $4,003 | $49,590 | $10,220 | $39,370 |
Source: Public Records
Map
Nearby Homes
- 927 Gravois Rd
- 840 Fall Crown Ln
- 260 Trueman Heritage Pkwy
- 818 Mary Lee Ct
- 1248 Green Knoll Dr
- The Westhampton Plan at Bowles Crossing
- The Rockport Plan at Bowles Crossing
- The Richmond Plan at Bowles Crossing
- The Liberty Plan at Bowles Crossing
- The Brookfield Plan at Bowles Crossing
- The Arlington Plan at Bowles Crossing
- 811 Mary Lee Ct
- The Westhampton Plan at Hawkins Point
- The Rockport Plan at Hawkins Point
- The Brookfield Plan at Hawkins Point
- The Liberty Plan at Hawkins Point
- The Arlington Plan at Hawkins Point
- 800 Mary Lee Ct
- 35 Pansy Dr Unit 35
- 901 Oak Dr
- 3 Fairview Place
- 505& 511 Summit Dr
- 498 Churchill Downs Manor Ct
- 5 Fairview Place
- 497 Churchill Downs Manor Ct
- 505 Summit Rd
- 494 Churchill Downs Manor Ct
- 504 Triple Crown Manor Ct
- 7 Fairview Place
- 499 Summit Rd
- 518 Summit Rd
- 493 Churchill Downs Manor Ct
- 490 Churchill Downs Manor Ct
- 519 Summit Rd
- 6 Fairview Place
- 433 Summit Rd
- 489 Churchill Downs Manor Ct
- 8 Fairview Place
- 501 Triple Crown Manor Ct
- 503 Triple Crown Manor Ct