Estimated Value: $570,000 - $691,000
3
Beds
2
Baths
2,261
Sq Ft
$283/Sq Ft
Est. Value
About This Home
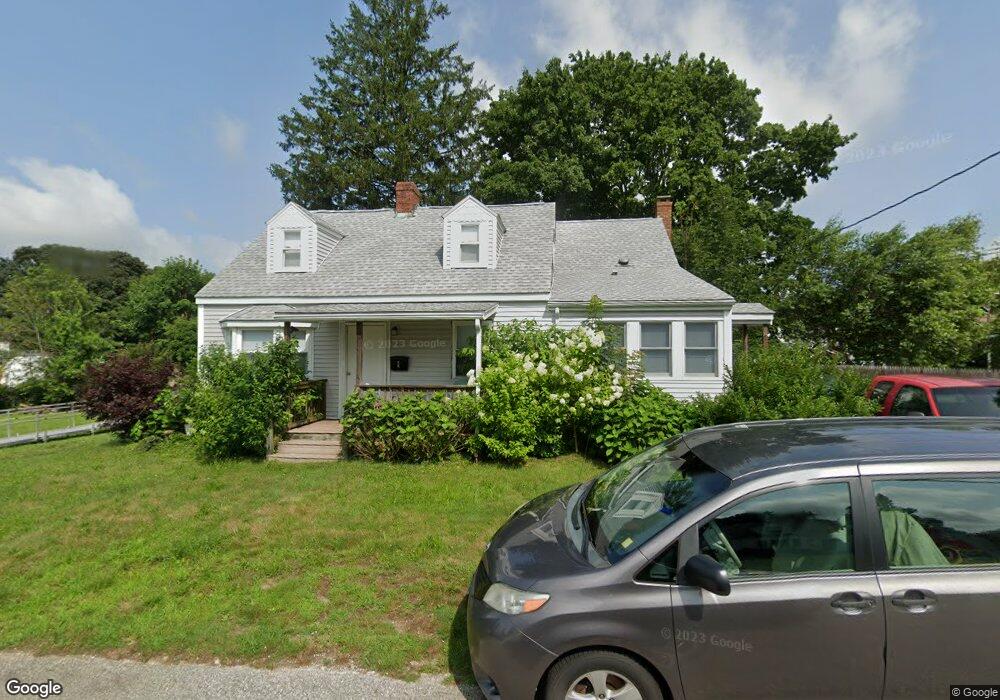
This home is located at 1 Faraday St, South Dartmouth, MA 02748 and is currently estimated at $640,635, approximately $283 per square foot. 1 Faraday St is a home located in Bristol County with nearby schools including Dartmouth High School and St. Teresa of Calcutta School.
Ownership History
Date
Name
Owned For
Owner Type
Purchase Details
Closed on
Dec 22, 2017
Sold by
Mcdonald James F and Mcdonald Marsha A
Bought by
Mcdonald Marsha A
Current Estimated Value
Purchase Details
Closed on
Jul 24, 2001
Sold by
Gifford Arthur W
Bought by
Mcdonald James F and Mcdonald Marsha A
Create a Home Valuation Report for This Property
The Home Valuation Report is an in-depth analysis detailing your home's value as well as a comparison with similar homes in the area
Home Values in the Area
Average Home Value in this Area
Purchase History
| Date | Buyer | Sale Price | Title Company |
|---|---|---|---|
| Mcdonald Marsha A | -- | -- | |
| Mcdonald James F | $209,000 | -- |
Source: Public Records
Mortgage History
| Date | Status | Borrower | Loan Amount |
|---|---|---|---|
| Previous Owner | Mcdonald James F | $125,000 | |
| Previous Owner | Mcdonald James F | $140,000 | |
| Previous Owner | Mcdonald James F | $125,000 | |
| Previous Owner | Mcdonald James F | $200,000 |
Source: Public Records
Tax History Compared to Growth
Tax History
| Year | Tax Paid | Tax Assessment Tax Assessment Total Assessment is a certain percentage of the fair market value that is determined by local assessors to be the total taxable value of land and additions on the property. | Land | Improvement |
|---|---|---|---|---|
| 2025 | $4,228 | $491,000 | $217,900 | $273,100 |
| 2024 | $4,197 | $483,000 | $217,900 | $265,100 |
| 2023 | $4,237 | $462,100 | $217,900 | $244,200 |
| 2022 | $4,241 | $428,400 | $217,900 | $210,500 |
| 2021 | $3,852 | $371,800 | $192,300 | $179,500 |
| 2020 | $3,633 | $350,000 | $184,600 | $165,400 |
| 2019 | $3,662 | $352,100 | $188,400 | $163,700 |
| 2018 | $3,293 | $320,800 | $179,400 | $141,400 |
| 2017 | $2,963 | $295,700 | $159,600 | $136,100 |
| 2016 | $3,032 | $298,400 | $163,300 | $135,100 |
| 2015 | $2,914 | $287,400 | $150,300 | $137,100 |
| 2014 | $2,889 | $283,000 | $148,600 | $134,400 |
Source: Public Records
Map
Nearby Homes