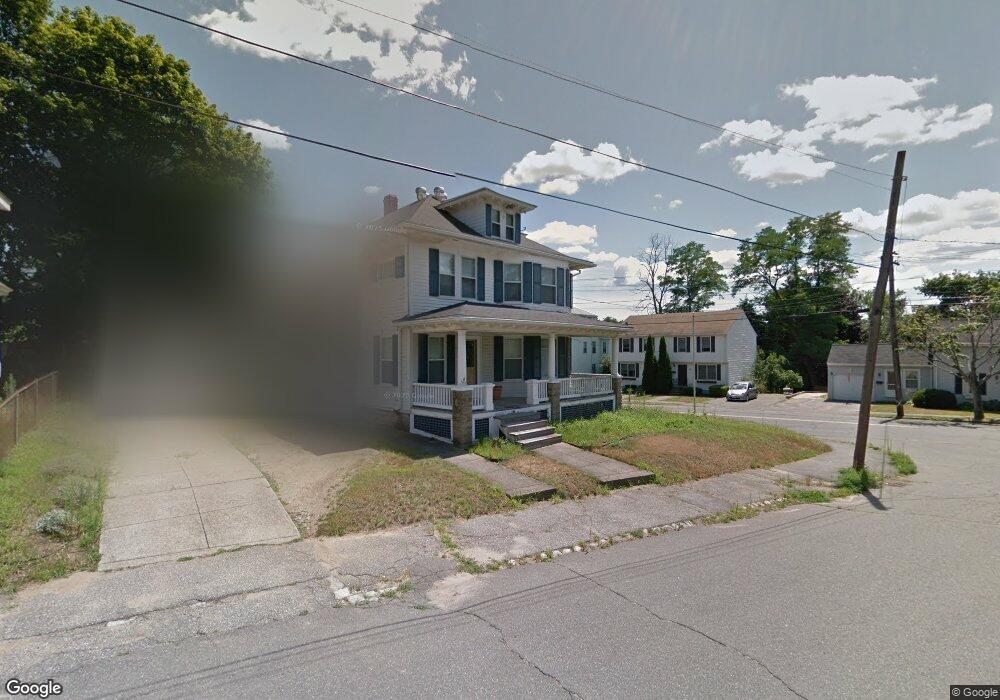
1 Fernald Ave Haverhill, MA 01830
Riverside NeighborhoodEstimated Value: $526,000 - $589,000
3
Beds
2
Baths
1,758
Sq Ft
$310/Sq Ft
Est. Value
About This Home
This home is located at 1 Fernald Ave, Haverhill, MA 01830 and is currently estimated at $545,601, approximately $310 per square foot. 1 Fernald Ave is a home located in Essex County with nearby schools including Golden Hill, Dr. Paul Nettle Middle School, and Haverhill High School.
Ownership History
Date
Name
Owned For
Owner Type
Purchase Details
Closed on
Aug 18, 1999
Sold by
Hicks Lawrence A and Hicks Catherine M
Bought by
Ross Brian J and Ross Sheryl A
Current Estimated Value
Home Financials for this Owner
Home Financials are based on the most recent Mortgage that was taken out on this home.
Original Mortgage
$86,000
Outstanding Balance
$24,617
Interest Rate
7.6%
Mortgage Type
Purchase Money Mortgage
Estimated Equity
$520,984
Create a Home Valuation Report for This Property
The Home Valuation Report is an in-depth analysis detailing your home's value as well as a comparison with similar homes in the area
Home Values in the Area
Average Home Value in this Area
Purchase History
| Date | Buyer | Sale Price | Title Company |
|---|---|---|---|
| Ross Brian J | $150,000 | -- |
Source: Public Records
Mortgage History
| Date | Status | Borrower | Loan Amount |
|---|---|---|---|
| Open | Ross Brian J | $86,000 |
Source: Public Records
Tax History Compared to Growth
Tax History
| Year | Tax Paid | Tax Assessment Tax Assessment Total Assessment is a certain percentage of the fair market value that is determined by local assessors to be the total taxable value of land and additions on the property. | Land | Improvement |
|---|---|---|---|---|
| 2025 | $4,740 | $442,600 | $151,300 | $291,300 |
| 2024 | $4,446 | $417,900 | $148,300 | $269,600 |
| 2023 | $4,393 | $394,000 | $148,300 | $245,700 |
| 2022 | $4,278 | $336,300 | $140,700 | $195,600 |
| 2021 | $3,993 | $297,100 | $125,600 | $171,500 |
| 2020 | $3,894 | $286,300 | $118,000 | $168,300 |
| 2019 | $3,783 | $271,200 | $102,900 | $168,300 |
| 2018 | $3,622 | $254,000 | $96,900 | $157,100 |
| 2017 | $3,568 | $238,000 | $93,800 | $144,200 |
| 2016 | $3,281 | $213,600 | $72,600 | $141,000 |
| 2015 | $3,385 | $220,500 | $72,600 | $147,900 |
Source: Public Records
Map
Nearby Homes
- 7 Pearson St
- 420 Water St
- 43 Buttonwoods Ave
- 29 Claremont Ave
- 121 Linwood St
- 104 Keeley St Unit A
- 14 Greystone Ave
- 12 Greystone Ave Unit 12
- 190 &196 Summer St
- 65 Madison St Unit 65
- 54 Lincoln Ave
- 12 Munroe St
- 332 Salem St Unit 1
- 12 Salem St Unit 2
- 26 Harding Ave
- 30 Colby St
- 32 Harding Ave
- 2 S Summer St
- 27 Byron St
- 65 Stetson St
- 76 Groveland St
- 69 Groveland St
- 69 Groveland St Unit 1
- 67 Groveland St
- 9 Fernald Ave
- 65 Groveland St
- 77 Groveland St
- 9 Shapleigh Ave Unit 9
- 62 Groveland St
- 75 Groveland St
- 11 Fernald Ave
- 10 Fernald Ave
- 7 Shapleigh Ave
- 59 Groveland St
- 84 Groveland St
- 15 Fernald Ave
- 5 Shapleigh Ave
- 8 Shapleigh Ave
- 10 Currier Ave
- 6 Pearson St