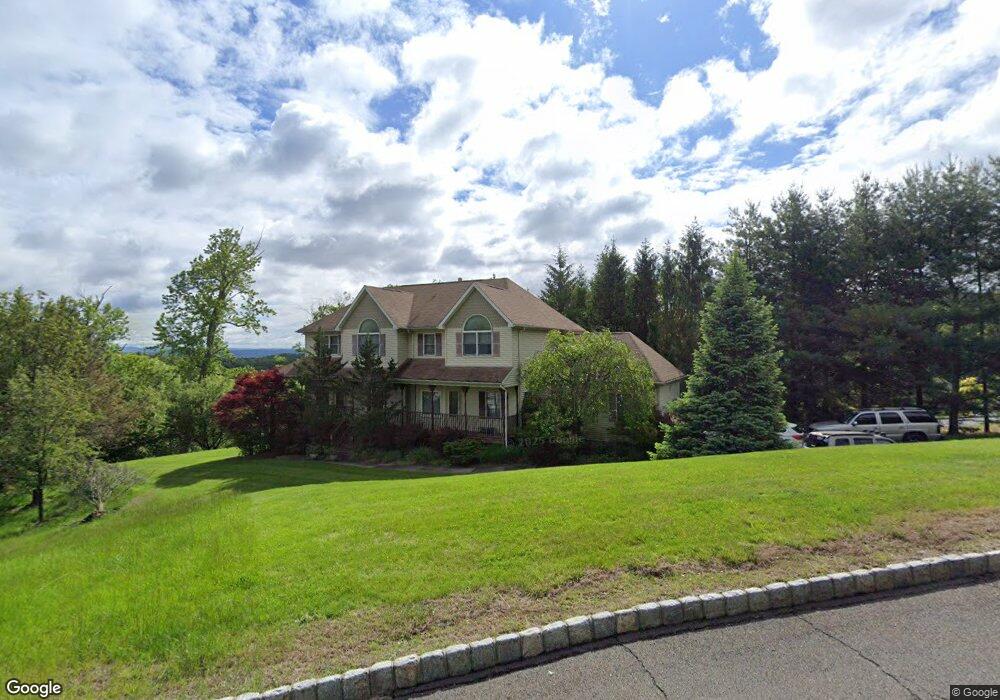
1 Fillmore Dr Stony Point, NY 10980
Estimated Value: $966,000 - $1,020,000
4
Beds
3
Baths
2,862
Sq Ft
$346/Sq Ft
Est. Value
About This Home
This home is located at 1 Fillmore Dr, Stony Point, NY 10980 and is currently estimated at $990,239, approximately $345 per square foot. 1 Fillmore Dr is a home located in Rockland County with nearby schools including James A. Farley Middle School, Stony Point Elementary School, and Fieldstone Secondary School.
Ownership History
Date
Name
Owned For
Owner Type
Purchase Details
Closed on
Feb 20, 2002
Sold by
Woodhills Circle Inc
Bought by
Jelen Roy A and Jelen Patricia
Current Estimated Value
Purchase Details
Closed on
Jul 20, 2000
Sold by
K Hovnanian At Stony Point Inc
Bought by
Rider Hill Realty Inc
Create a Home Valuation Report for This Property
The Home Valuation Report is an in-depth analysis detailing your home's value as well as a comparison with similar homes in the area
Home Values in the Area
Average Home Value in this Area
Purchase History
| Date | Buyer | Sale Price | Title Company |
|---|---|---|---|
| Jelen Roy A | $430,000 | Old Republic Natl Title Ins | |
| Woodhills Circle Inc | -- | Old Republic Natl Title Ins | |
| Rider Hill Realty Inc | $400,000 | -- |
Source: Public Records
Tax History Compared to Growth
Tax History
| Year | Tax Paid | Tax Assessment Tax Assessment Total Assessment is a certain percentage of the fair market value that is determined by local assessors to be the total taxable value of land and additions on the property. | Land | Improvement |
|---|---|---|---|---|
| 2024 | $23,468 | $70,500 | $10,500 | $60,000 |
| 2023 | $23,468 | $70,500 | $10,500 | $60,000 |
| 2022 | $6,477 | $70,500 | $10,500 | $60,000 |
| 2021 | $6,477 | $70,500 | $10,500 | $60,000 |
| 2020 | $14,551 | $70,500 | $10,500 | $60,000 |
| 2019 | $4,570 | $70,500 | $10,500 | $60,000 |
| 2018 | $14,135 | $70,500 | $10,500 | $60,000 |
| 2017 | $14,107 | $70,500 | $10,500 | $60,000 |
| 2016 | $14,623 | $70,500 | $10,500 | $60,000 |
| 2015 | -- | $70,500 | $10,500 | $60,000 |
| 2014 | -- | $70,500 | $10,500 | $60,000 |
Source: Public Records
Map
Nearby Homes