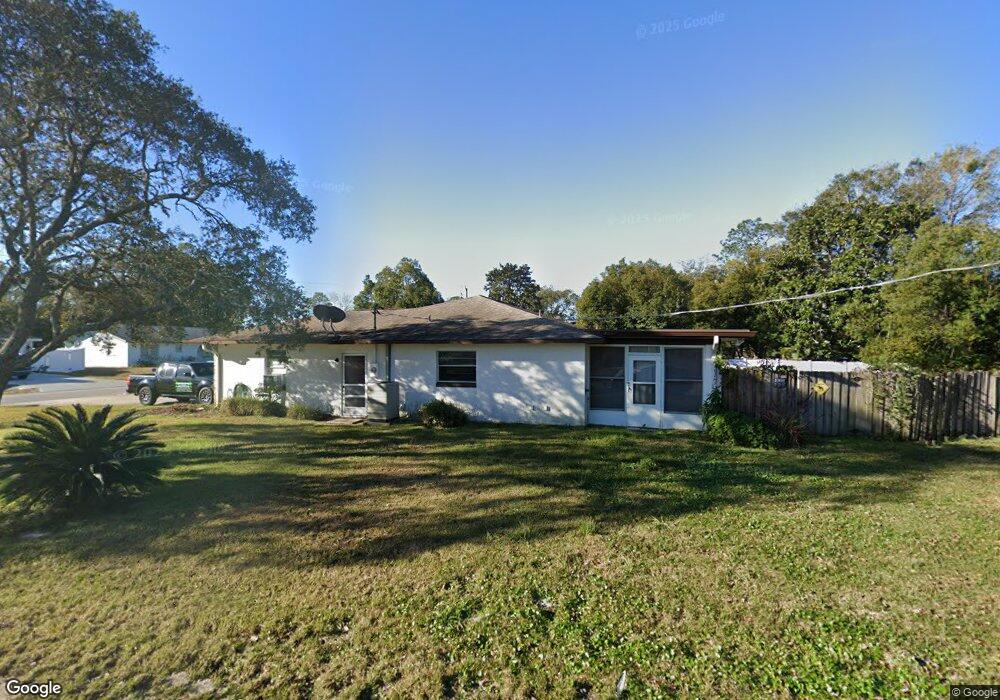
1 Fillmore Ln Palm Coast, FL 32137
Estimated Value: $244,000 - $303,000
2
Beds
2
Baths
1,438
Sq Ft
$186/Sq Ft
Est. Value
About This Home
This home is located at 1 Fillmore Ln, Palm Coast, FL 32137 and is currently estimated at $267,770, approximately $186 per square foot. 1 Fillmore Ln is a home located in Flagler County with nearby schools including Old Kings Elementary School, Indian Trails Middle School, and Matanzas High School.
Ownership History
Date
Name
Owned For
Owner Type
Purchase Details
Closed on
Jan 14, 2014
Sold by
Federal National Mortgage Association
Bought by
Gurell Richard G
Current Estimated Value
Purchase Details
Closed on
Nov 27, 2013
Sold by
Cenlar Fsb
Bought by
Federal Home Loan Mortgage Corporation
Purchase Details
Closed on
Sep 11, 2013
Sold by
Carroll Henrietta E
Bought by
Cenlar Fsb
Purchase Details
Closed on
Aug 5, 2008
Sold by
Robison James S
Bought by
Robison James S and Carroll Henrietta E
Purchase Details
Closed on
Oct 18, 2007
Sold by
Smith Frances O
Bought by
Robison James S
Home Financials for this Owner
Home Financials are based on the most recent Mortgage that was taken out on this home.
Original Mortgage
$114,000
Interest Rate
6.26%
Mortgage Type
Purchase Money Mortgage
Purchase Details
Closed on
Mar 6, 2003
Sold by
Smith Frances Orcutt
Bought by
Smith Frances O
Create a Home Valuation Report for This Property
The Home Valuation Report is an in-depth analysis detailing your home's value as well as a comparison with similar homes in the area
Home Values in the Area
Average Home Value in this Area
Purchase History
| Date | Buyer | Sale Price | Title Company |
|---|---|---|---|
| Gurell Richard G | $87,200 | Attorney | |
| Federal Home Loan Mortgage Corporation | -- | Attorney | |
| Cenlar Fsb | -- | None Available | |
| Robison James S | $59,500 | None Available | |
| Robison James S | $142,500 | None Available | |
| Smith Frances O | -- | -- |
Source: Public Records
Mortgage History
| Date | Status | Borrower | Loan Amount |
|---|---|---|---|
| Previous Owner | Robison James S | $114,000 |
Source: Public Records
Tax History Compared to Growth
Tax History
| Year | Tax Paid | Tax Assessment Tax Assessment Total Assessment is a certain percentage of the fair market value that is determined by local assessors to be the total taxable value of land and additions on the property. | Land | Improvement |
|---|---|---|---|---|
| 2024 | $3,096 | $216,098 | -- | -- |
| 2023 | $3,096 | $209,804 | $42,000 | $167,804 |
| 2022 | $3,432 | $220,906 | $48,500 | $172,406 |
| 2021 | $2,981 | $163,095 | $24,000 | $139,095 |
| 2020 | $2,676 | $135,287 | $19,000 | $116,287 |
| 2019 | $2,620 | $134,287 | $18,000 | $116,287 |
| 2018 | $2,443 | $124,683 | $16,000 | $108,683 |
| 2017 | $2,182 | $107,025 | $16,000 | $91,025 |
| 2016 | $2,048 | $100,453 | $0 | $0 |
| 2015 | $1,995 | $97,136 | $0 | $0 |
| 2014 | $1,770 | $84,992 | $0 | $0 |
Source: Public Records
Map
Nearby Homes