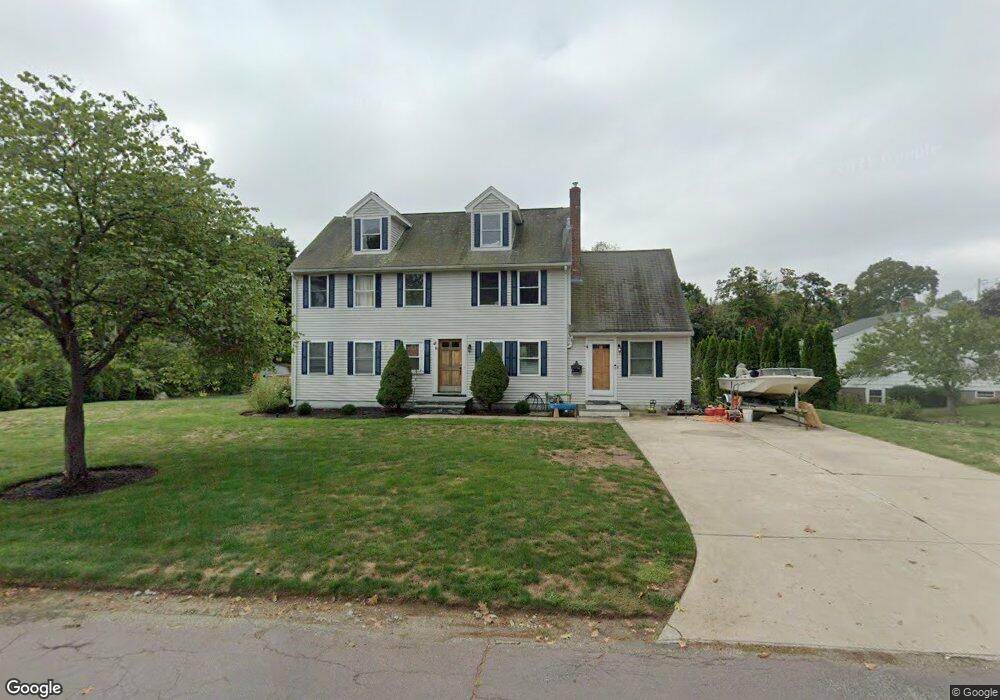
1 Fisher Rd Hingham, MA 02043
Estimated Value: $983,000 - $1,432,000
4
Beds
3
Baths
2,520
Sq Ft
$475/Sq Ft
Est. Value
About This Home
This home is located at 1 Fisher Rd, Hingham, MA 02043 and is currently estimated at $1,197,939, approximately $475 per square foot. 1 Fisher Rd is a home located in Plymouth County with nearby schools including East Elementary School, St. Paul Elementary School, and Derby Academy.
Ownership History
Date
Name
Owned For
Owner Type
Purchase Details
Closed on
Apr 6, 2018
Sold by
Delaney Patricia M
Bought by
Lee-Delaney Shannon and Canavan John P
Current Estimated Value
Home Financials for this Owner
Home Financials are based on the most recent Mortgage that was taken out on this home.
Original Mortgage
$300,000
Outstanding Balance
$255,711
Interest Rate
4.25%
Mortgage Type
New Conventional
Estimated Equity
$942,228
Purchase Details
Closed on
Jun 2, 2005
Sold by
Debard Davis Stuart
Bought by
Warwick Kyle B and Martin Monica M
Purchase Details
Closed on
Jul 15, 1996
Sold by
Debard Linda W and Debard Davis M
Bought by
Delaney Michael J
Purchase Details
Closed on
Aug 23, 1988
Sold by
Brooke Winfred P
Bought by
Debard Davis M
Create a Home Valuation Report for This Property
The Home Valuation Report is an in-depth analysis detailing your home's value as well as a comparison with similar homes in the area
Home Values in the Area
Average Home Value in this Area
Purchase History
| Date | Buyer | Sale Price | Title Company |
|---|---|---|---|
| Lee-Delaney Shannon | $600,000 | -- | |
| Warwick Kyle B | -- | -- | |
| Delaney Michael J | $140,000 | -- | |
| Debard Davis M | $157,000 | -- |
Source: Public Records
Mortgage History
| Date | Status | Borrower | Loan Amount |
|---|---|---|---|
| Open | Lee-Delaney Shannon | $300,000 | |
| Previous Owner | Debard Davis M | $50,000 | |
| Previous Owner | Debard Davis M | $152,600 |
Source: Public Records
Tax History Compared to Growth
Tax History
| Year | Tax Paid | Tax Assessment Tax Assessment Total Assessment is a certain percentage of the fair market value that is determined by local assessors to be the total taxable value of land and additions on the property. | Land | Improvement |
|---|---|---|---|---|
| 2025 | $9,983 | $933,900 | $340,300 | $593,600 |
| 2024 | $9,577 | $882,700 | $340,300 | $542,400 |
| 2023 | $8,100 | $810,000 | $316,000 | $494,000 |
| 2022 | $7,772 | $672,300 | $275,400 | $396,900 |
| 2021 | $7,530 | $638,100 | $275,400 | $362,700 |
| 2020 | $7,357 | $638,100 | $275,400 | $362,700 |
| 2019 | $7,023 | $594,700 | $275,400 | $319,300 |
| 2018 | $7,000 | $594,700 | $275,400 | $319,300 |
| 2017 | $6,564 | $535,800 | $283,500 | $252,300 |
| 2016 | $6,524 | $522,300 | $270,000 | $252,300 |
| 2015 | $6,153 | $491,100 | $238,800 | $252,300 |
Source: Public Records
Map
Nearby Homes
- 114 Hull St
- 129 Chief Justice Cushing Hwy
- LOT 1B Rockland St
- 166 Hull St
- 10 Chestnut Place
- 101 Rockland St
- 321 Rockland St
- 6 Grace Dr
- 45 Ocean Ledge Dr
- 33 Turkey Hill Ln
- 10 Ocean Ledge Dr
- 105 East St
- 8 Evergreen Ln
- 1 Rockland St
- 152 Forest Ave
- 1 Gatehouse Ln Unit 1
- 82 East St
- 29 Heather Dr
- 10R Martins Ln
- 25 Rockwood Rd