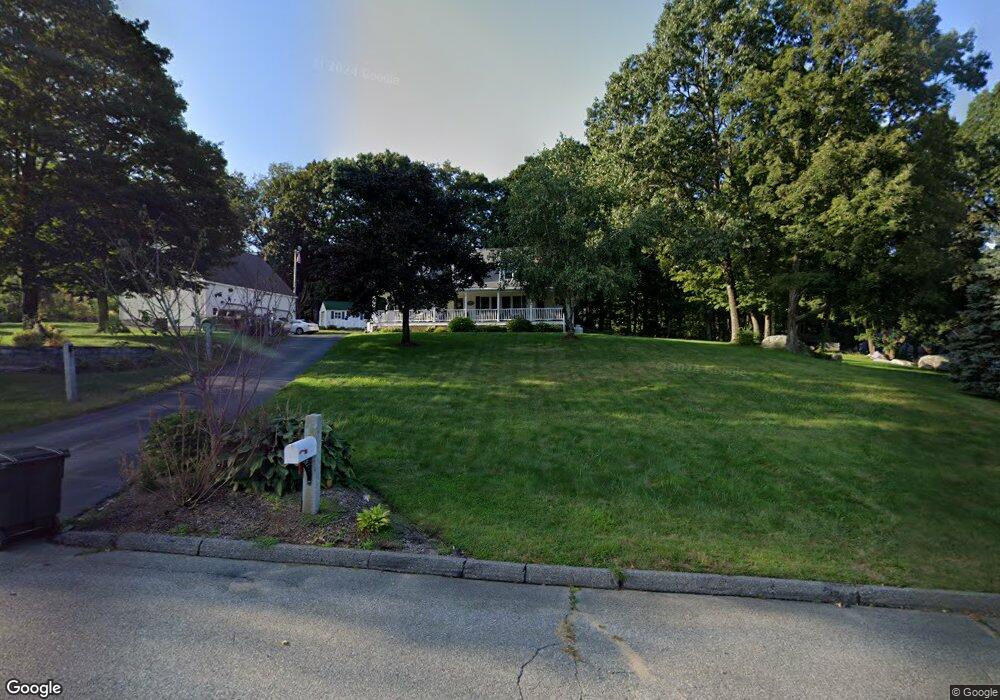
1 Flagg Dr Leicester, MA 01524
Estimated Value: $592,000 - $611,000
3
Beds
2
Baths
2,156
Sq Ft
$279/Sq Ft
Est. Value
About This Home
This home is located at 1 Flagg Dr, Leicester, MA 01524 and is currently estimated at $600,466, approximately $278 per square foot. 1 Flagg Dr is a home located in Worcester County with nearby schools including Leicester Integrated Preschool, Leicester Memorial Elementary School, and Leicester Middle School.
Ownership History
Date
Name
Owned For
Owner Type
Purchase Details
Closed on
Apr 8, 2024
Sold by
Almstrom Deborah A
Bought by
Almstrom Irt and Almstrom
Current Estimated Value
Purchase Details
Closed on
Jan 11, 2000
Sold by
Kennedy Stephen J and Resource Bancshares Mt
Bought by
Almstrom Deborah A and Almstrom Paul R
Purchase Details
Closed on
Nov 12, 1992
Sold by
Flagg Rt
Bought by
Kennedy Stephen and Kennedy Kelly
Create a Home Valuation Report for This Property
The Home Valuation Report is an in-depth analysis detailing your home's value as well as a comparison with similar homes in the area
Home Values in the Area
Average Home Value in this Area
Purchase History
| Date | Buyer | Sale Price | Title Company |
|---|---|---|---|
| Almstrom Irt | -- | None Available | |
| Almstrom Deborah A | $174,000 | -- | |
| Kennedy Stephen | $39,000 | -- |
Source: Public Records
Mortgage History
| Date | Status | Borrower | Loan Amount |
|---|---|---|---|
| Previous Owner | Kennedy Stephen | $50,000 | |
| Previous Owner | Kennedy Stephen | $140,000 |
Source: Public Records
Tax History Compared to Growth
Tax History
| Year | Tax Paid | Tax Assessment Tax Assessment Total Assessment is a certain percentage of the fair market value that is determined by local assessors to be the total taxable value of land and additions on the property. | Land | Improvement |
|---|---|---|---|---|
| 2025 | $68 | $573,800 | $86,800 | $487,000 |
| 2024 | $6,456 | $514,400 | $74,800 | $439,600 |
| 2023 | $6,115 | $475,500 | $74,800 | $400,700 |
| 2022 | $5,867 | $419,400 | $71,000 | $348,400 |
| 2021 | $6,456 | $426,700 | $78,500 | $348,200 |
| 2020 | $5,943 | $398,600 | $74,400 | $324,200 |
| 2019 | $5,718 | $379,200 | $67,400 | $311,800 |
| 2018 | $5,524 | $343,300 | $67,400 | $275,900 |
| 2017 | $5,203 | $336,100 | $67,400 | $268,700 |
| 2016 | $4,695 | $315,100 | $71,000 | $244,100 |
| 2015 | $4,582 | $315,100 | $71,000 | $244,100 |
Source: Public Records
Map
Nearby Homes