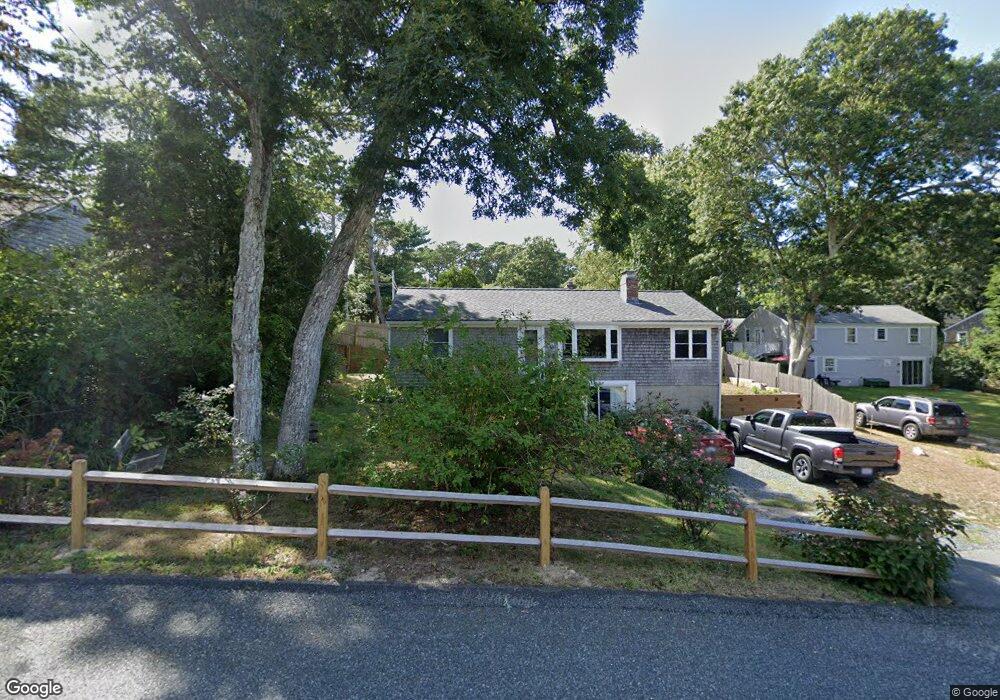
1 Flax St Dennis, MA 02638
Dennis Village NeighborhoodEstimated Value: $545,000 - $984,000
3
Beds
1
Bath
800
Sq Ft
$857/Sq Ft
Est. Value
About This Home
This home is located at 1 Flax St, Dennis, MA 02638 and is currently estimated at $685,438, approximately $856 per square foot. 1 Flax St is a home located in Barnstable County with nearby schools including Dennis-Yarmouth Regional High School.
Ownership History
Date
Name
Owned For
Owner Type
Purchase Details
Closed on
May 30, 1995
Sold by
Cisek Ruth A
Bought by
Curran James G
Current Estimated Value
Home Financials for this Owner
Home Financials are based on the most recent Mortgage that was taken out on this home.
Original Mortgage
$82,500
Interest Rate
8.33%
Mortgage Type
Purchase Money Mortgage
Create a Home Valuation Report for This Property
The Home Valuation Report is an in-depth analysis detailing your home's value as well as a comparison with similar homes in the area
Home Values in the Area
Average Home Value in this Area
Purchase History
| Date | Buyer | Sale Price | Title Company |
|---|---|---|---|
| Curran James G | $82,500 | -- |
Source: Public Records
Mortgage History
| Date | Status | Borrower | Loan Amount |
|---|---|---|---|
| Closed | Curran James G | $82,500 |
Source: Public Records
Tax History
| Year | Tax Paid | Tax Assessment Tax Assessment Total Assessment is a certain percentage of the fair market value that is determined by local assessors to be the total taxable value of land and additions on the property. | Land | Improvement |
|---|---|---|---|---|
| 2025 | $2,295 | $530,100 | $181,300 | $348,800 |
| 2024 | $2,162 | $492,500 | $174,400 | $318,100 |
| 2023 | $1,977 | $423,300 | $134,100 | $289,200 |
| 2022 | $1,870 | $334,000 | $120,800 | $213,200 |
| 2021 | $1,776 | $294,600 | $118,500 | $176,100 |
| 2020 | $38,230 | $288,900 | $129,200 | $159,700 |
| 2019 | $38,639 | $302,400 | $158,400 | $144,000 |
| 2018 | $1,584 | $249,800 | $120,600 | $129,200 |
| 2017 | $1,511 | $245,700 | $120,600 | $125,100 |
| 2016 | $1,469 | $224,900 | $120,600 | $104,300 |
| 2015 | $1,439 | $224,900 | $120,600 | $104,300 |
| 2014 | $1,300 | $204,800 | $100,500 | $104,300 |
Source: Public Records
Map
Nearby Homes
- 59 Main St Unit 19-2
- 59 Route 6a Unit 29-4
- 59 Massachusetts 6a Unit 19-2
- 568 Route 6a
- 26 S West Dr
- 20 Bray Farm Rd S
- 268 Main St
- 15 Musket Ln
- 16 Hazelwood Rd
- 10 Uncle Bills Way
- 54 Kates Path Unit 54
- 52 Uncle Bobs Way
- 15 John Hall Cartway Unit 15
- 228 Kates Path
- 6 Thomas Ct
- 480 Main St
- 15 Signal Hill Dr
- 3212 Heatherwood Unit 3212
- 118 Driftwood Ln
- 35 Crown Grant Dr
Your Personal Tour Guide
Ask me questions while you tour the home.